pofff.visualization.maps module#
Create spatial benchmark overlays from simulation and experiment data.
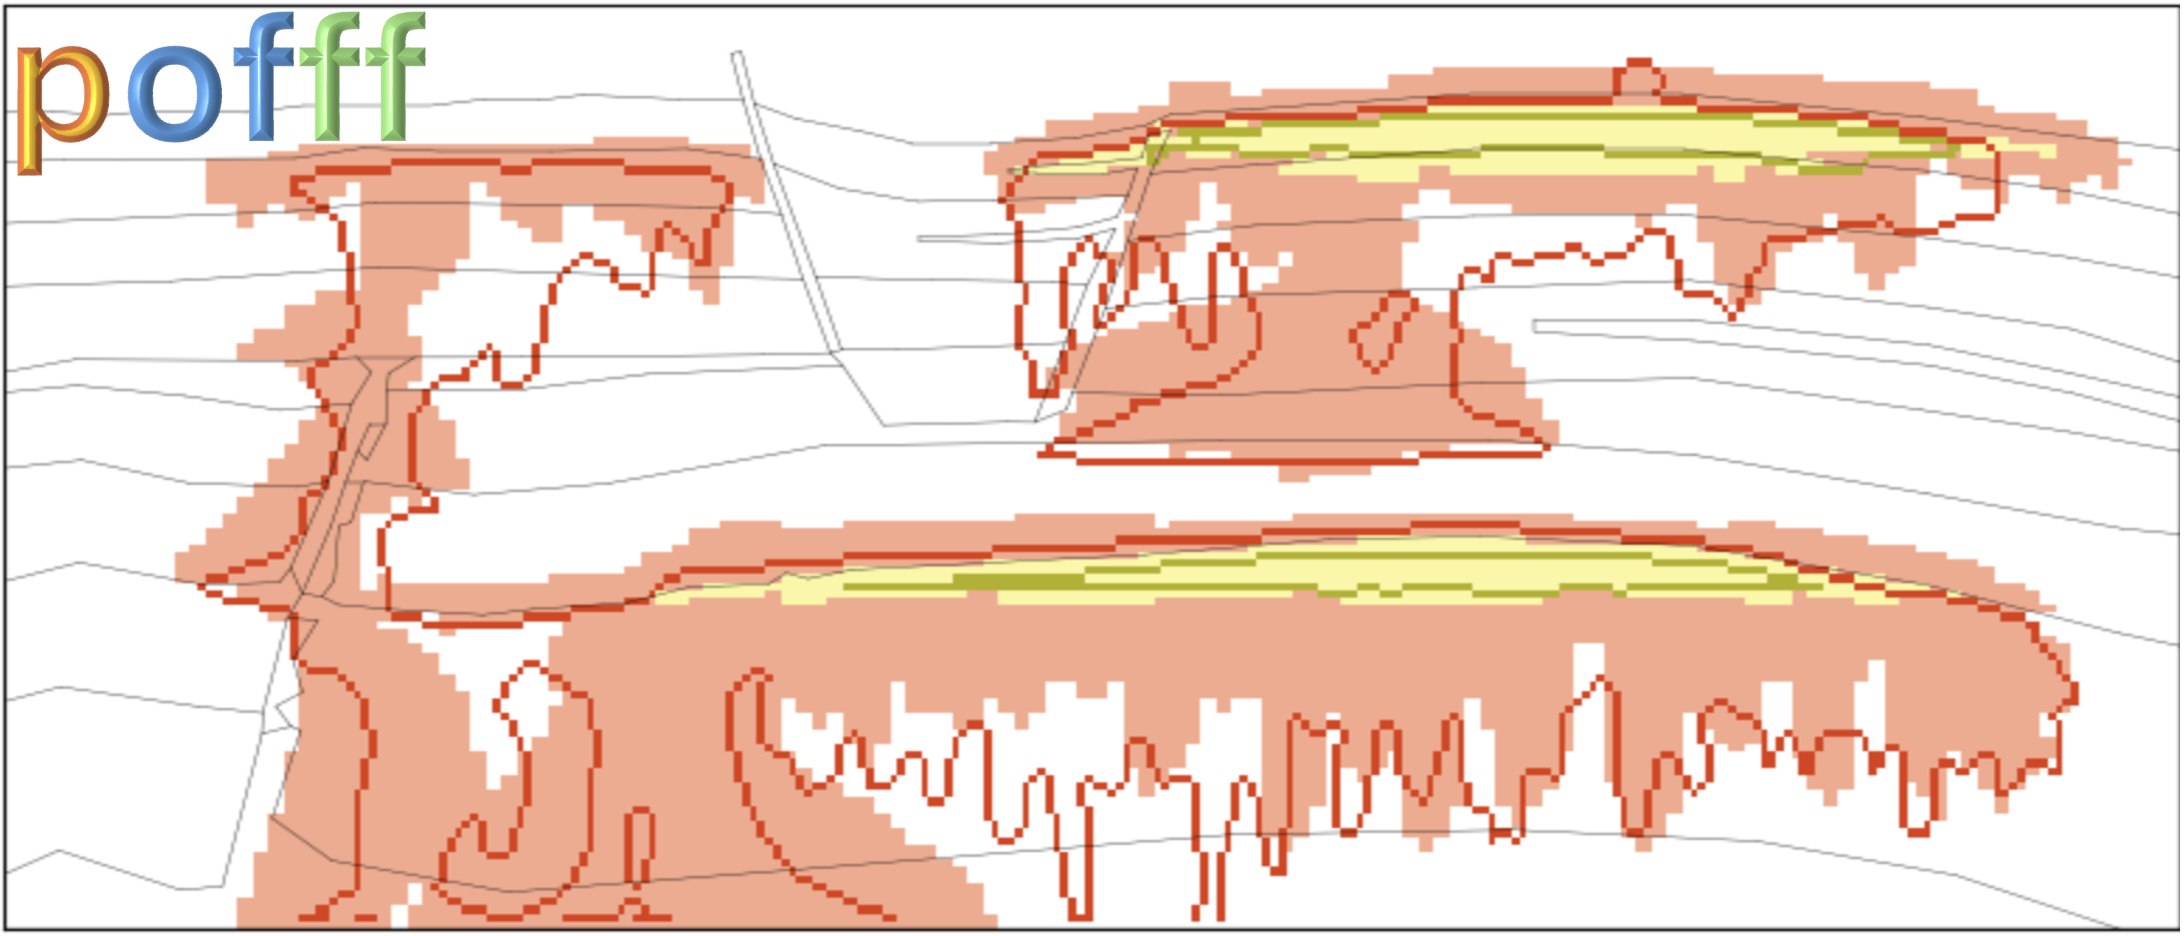
Simulation saturation and dissolved-CO2 fields are segmented on the FluidFlower reporting grid, combined with experimental contour boundaries and geological lines, and written as maps for the requested evaluation times.
- pofff.visualization.maps._load_geological_lines(path)[source]#
Load geological points and line connectivity for plotting.
- Parameters:
- pathobject
Input, output, or project path.
- pofff.visualization.maps._segment_simulation_fields(filename, satmin, conmin)[source]#
Segment saturation and concentration on the reporting grid.
- Parameters:
- filenameobject
Path to the input file.
- satminobject
Minimum gas-saturation threshold.
- conminobject
Minimum dissolved-CO2 concentration threshold.
- pofff.visualization.maps._write_overlay_map(simulations, experiment, x, z, points, lines, t)[source]#
Write one simulation and experiment overlay map.
The figure is written as
map_<time>h.pngin the current directory.- Parameters:
- simulationsobject
Segmented simulation classes on the benchmark reporting grid.
- experimentobject
Segmented experimental classes on the benchmark reporting grid.
- xobject
Cell or plotting x coordinates in metres.
- zobject
Cell or plotting z coordinates in metres.
- pointsobject
Geological points represented by x and z coordinates in metres.
- linesobject
Pairs of point indices defining geological line segments.
- tobject
Evaluation time label in hours.