Visualization with plopm#
Overview#
plopm can postprocess the OPM Flow results generated by pofff and create customized PNG figures and GIF animations.
Installation#
pip install git+https://github.com/cssr-tools/plopm.git
Configuration#
Run publication/appendixb.toml after replacing its inj schedule with:
inj = [
    [8100, 300, 3E-7, 0],
    [10200, 300, 3E-7, 3E-7],
    [3300, 300, 0, 0],
    [64800, 3600, 0, 0],
    [345600, 21600, 0, 0],
]
Commands#
Generate the OPM Flow result without the pofff benchmark figures:
pofff -i appendixb.toml -o pofff+plopm -m single -c 5e-2 -f none
Generate the dissolved-CO2 animation:
plopm -v xco2l -i 'pofff+plopm/POFFF+PLOPM' -fs 16,5 -mv satnum -m gif -dpi 1000 -fz 20 -gl 1 -cbf .1e -cbp 0.30,0.01,0.4,0.02 -gi 437.5 -mt 1e-5 -tu h -cbn 5 -cbl 'CO$_2$ mass fraction in liquid [-]' -t 'FluidFlower simulation (GitHub/cssr-tools/pofff),'
Result#
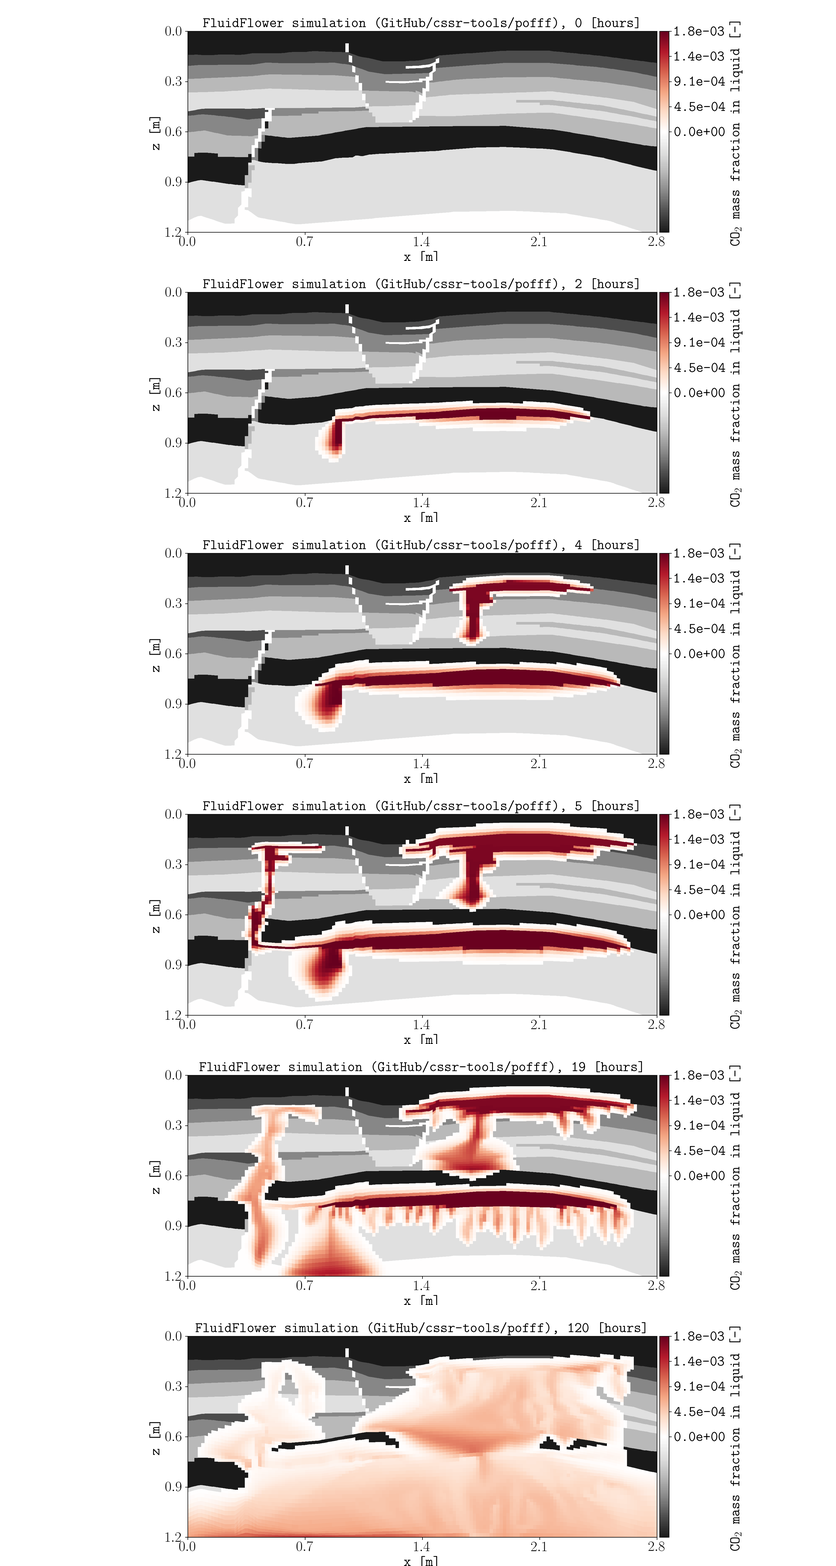
The documented five-day simulation completed in less than two minutes using eight OPM Flow CPUs on a Mac.#
See the plopm documentation for the complete plotting and animation reference.
Reproduce the example#
Run the maintained documentation script from the repository root:
. ./tests/scripts/docs_visualization.sh