4. Generate the comparison figures#
4.1. Goal#
Locate the figures that compare the YOURS result with the experimental and
published FluidFlower benchmark data.
4.2. Configuration#
The original command used -f all. This produces the basic benchmark figures
and the Wasserstein-distance comparisons. The complete set requires evaluation
times of 24, 48, 72, 96, and 120 hours.
4.3. Command#
The figures were already generated by the combined tutorial command. To regenerate figures from existing data without rerunning OPM Flow, use:
pofff -o YOURS -m none -t 24,48,72,96,120 -f all
4.4. How it works#
In none mode, pofff skips model generation and simulation. It reads the
existing benchmark-format CSV files and recreates spatial overlays, time-series
comparisons, sparse-data comparisons, Wasserstein-distance products, and the
error table.
4.5. Result#
One of the principal outputs is:
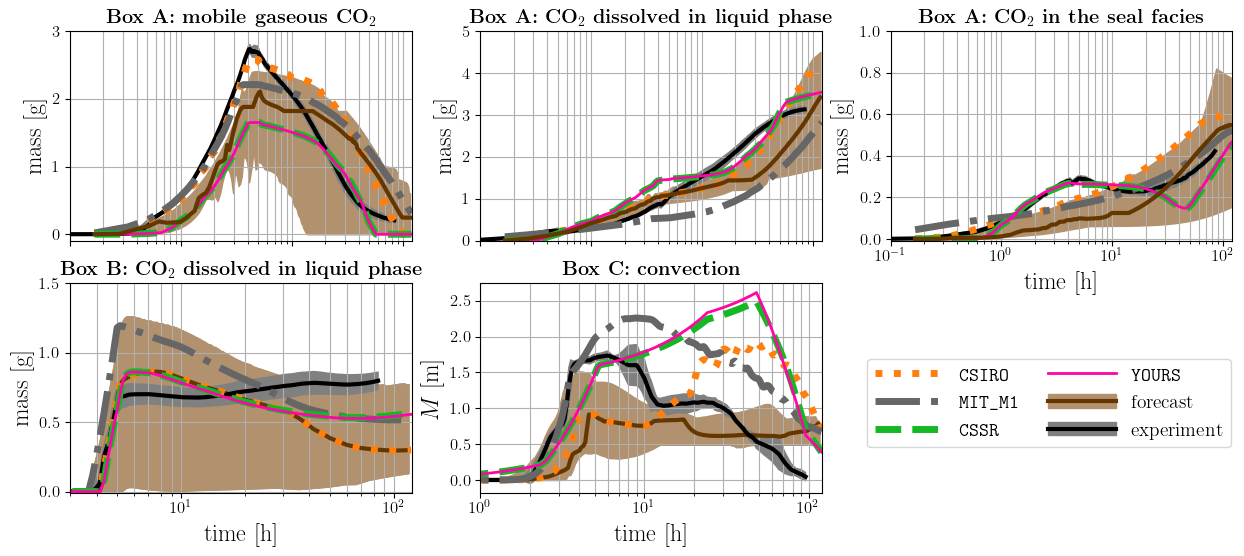
Published FluidFlower results with the new simulation labeled by its output directory name.#
The figure should include a series labeled YOURS. If it does not, verify that
the output directory and benchmark CSV files are in the locations expected by
the postprocessing workflow.
4.6. Next#
Continue with Interpret and improve the results.