Wells, schedules, and TUNING#
The well and schedule settings define well trajectories, injected fluid, injection rates, report frequency, optional site-boundary wells, and OPM Flow TUNING values.
Well coordinates#
Each well_coords row contains x, y, initial z, and final z positions in
metres. Any number of wells can be added to the site and regional models.
well_coords = [
    [21180, 7068, 0, 81],
    [24200, 7800, 15, 65],
    [21718, 7122, 45, 81],
    [14518, 11377, 0, 50],
    [31679, 8883, 0, 30],
    [28477, 2732, 0, 81],
]
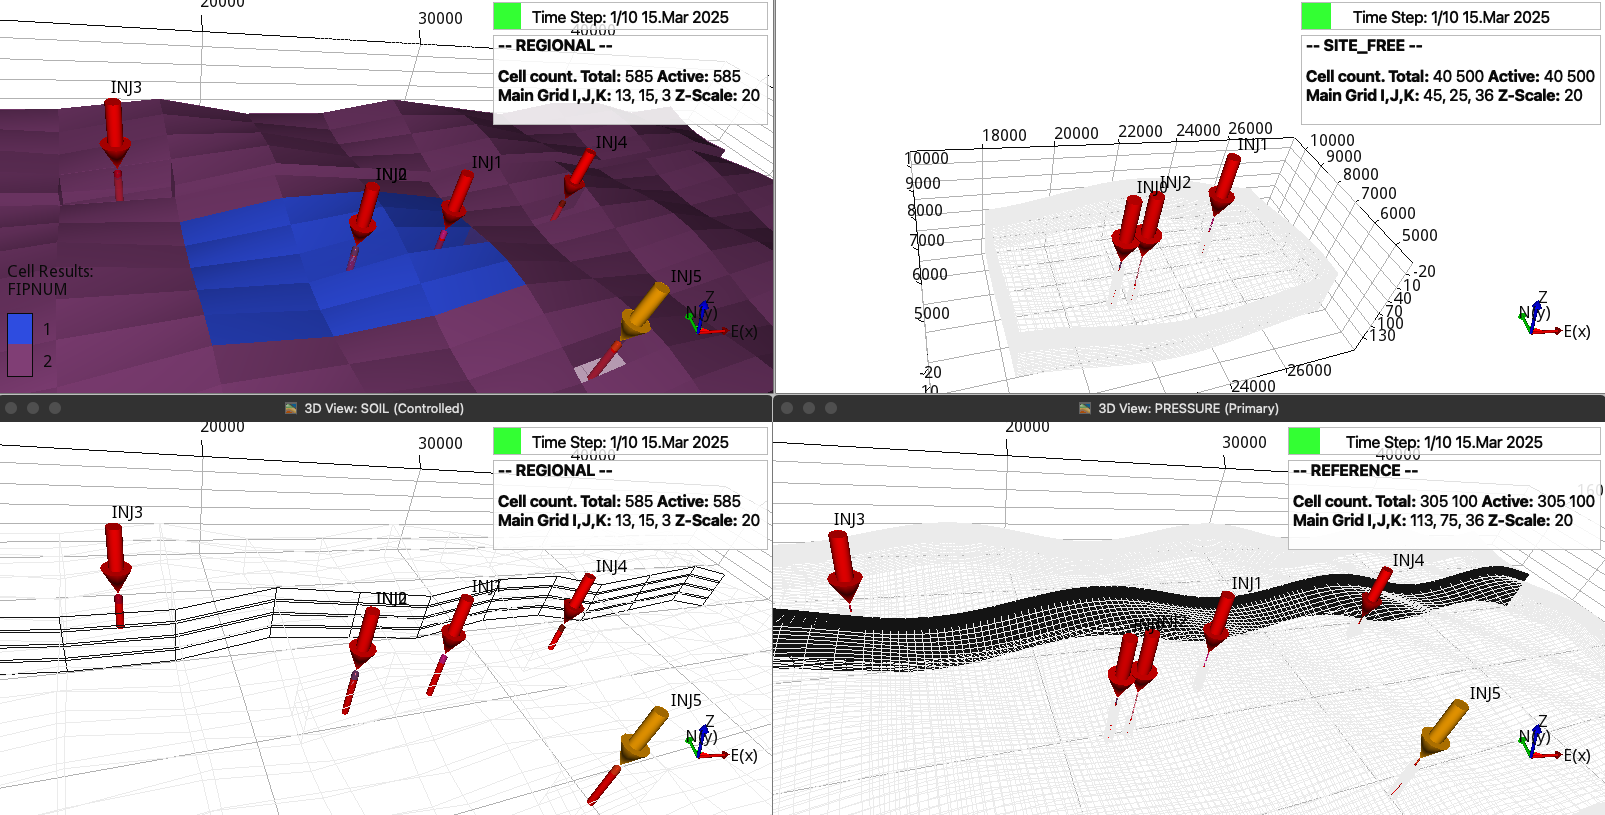
Well locations in the regional, site, and reference models. In the coarser regional model, wells 0 and 2 share cells along the z direction.#
Schedule structure#
Each inj entry contains two arrays. The first contains injection duration,
regional output time step, and site/reference output time step in days. The
second contains one fluid identifier and injection rate pair per well. Fluid 0
is water and fluid 1 is CO2; rates are in kg/day.
For six wells, each schedule row contains the three timing values and 12
fluid-rate values. When site_bctype is wells, append boundary-well
controls in bottom, right, top, and left order. Each control contains 0 for a
producer or 1 for an injector, followed by BHP in bar.
The full nested schedule from input.toml is retained in Complete annotated TOML configuration.
See example1_wells.toml
for a boundary-well case.
TUNING#
If the Flow command enables TUNING, add a string to each timing array. The string follows the OPM TUNING record order. OPM Flow supports 34 options and uses defaults for omitted entries.
For example, the following strings retain the first default and set TSMAXZ
to 10 and 20 days:
inj = [
    [[365, 73, 73, "1* 10"], [1, 3e5, 1, 3e5, 1, 3e5, 1, 5e6, 1, 5e6, 0, 1e7]],
    [[365, 73, 73, "1* 20"], [1, 3e5, 1, 3e5, 1, 3e5, 1, 5e6, 1, 0, 0, 1e7]],
]
TUNING can restrict time steps during high injection and relax them while wells are shut. Consult the OPM Flow manual for all records and defaults. A related multi-record example is available in pyopmspe11.
Run the integrated study#
When the configuration is named input.toml, run:
expreccs
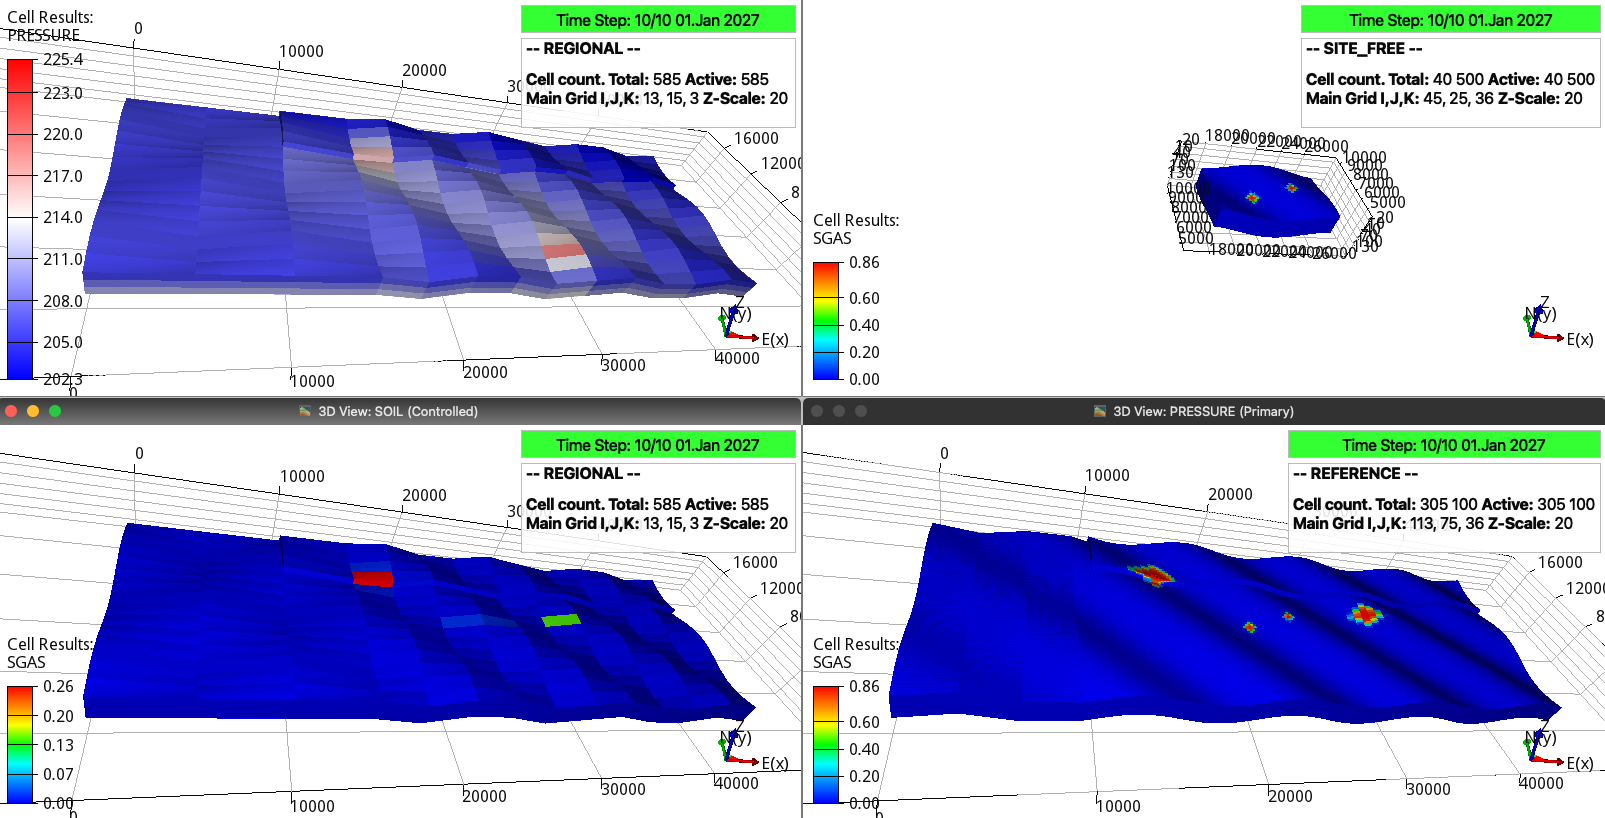
ResInsight visualization of pressure and gas saturation. The intended next comparison projects regional fluxes or pressures to the site boundaries instead of using open boundaries.#