Graphical abstract#
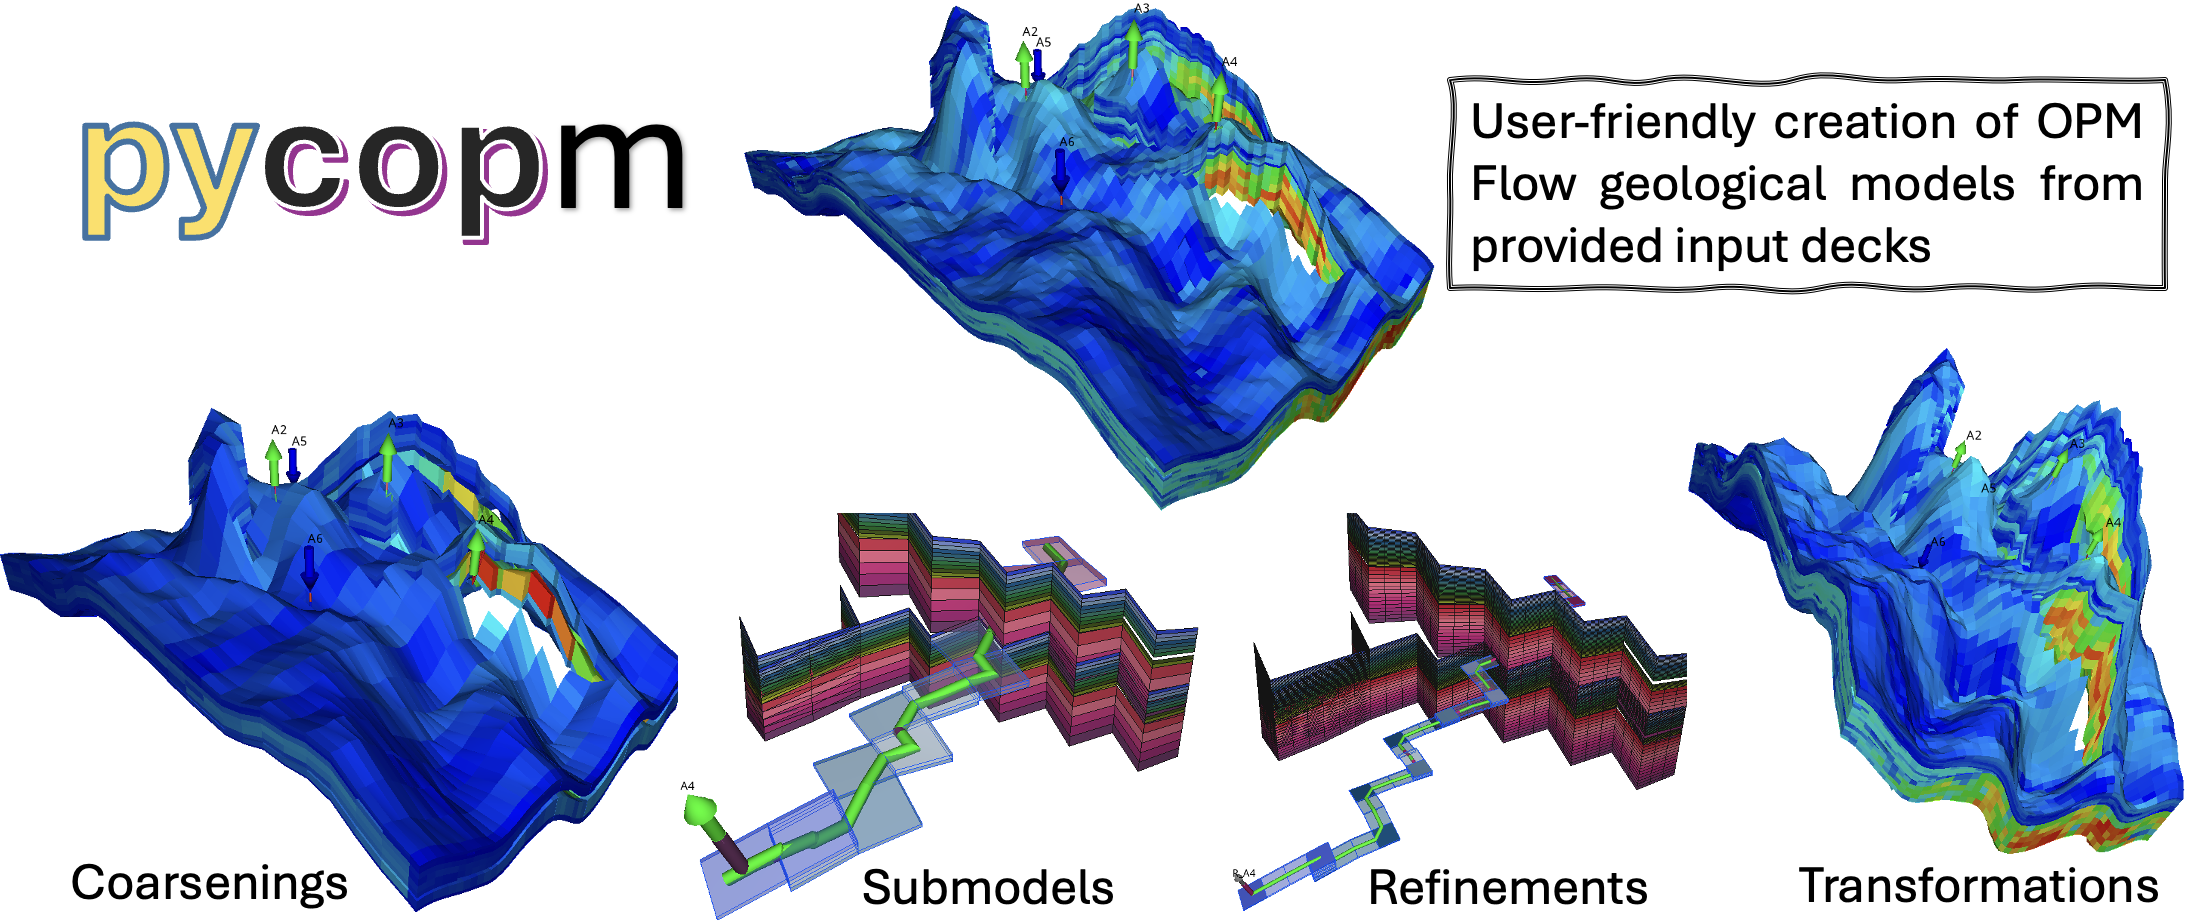
Here we describe how to generate the geological model ilustrations in the graphical abstract. These five ilustrations are generated from the DROGON_HIST.DATA model, and the visualization is achieve using ResInsight.

Top figure: By running the DROGON_HIST.DATA using opm flow and visaluazing the static property pore volume.
Coarsenings: This corresponds to the generated DROGON_HIST_PYCOPM_PYCOPM.DATA deck in Drogon.
Submodels: pycopm -i DROGON_HIST.DATA -v 'xypolygon [463739,5931508] [464872,5932123] [464401,5932862] [463284,5932209] [463739,5931508]' -w SUBMODELS -m all
Refinements: pycopm -i SUBMODELS.DATA -g 2,2,2 -w REFINEMENTS -m all
Transformations: pycopm -i DROGON_HIST.DATA -d 'rotatexy 45' -w TRANSFORMATIONS -m all
Note that for ResInsight to show the wells, one needs to run the decks (e.g., flow REFINEMENTS.DATA).