
GIFs and masks#
Create GIF animations from restart steps and use a static model property as a background mask.
Prepare the comparison cases#
This example compares a base SPE11B simulation with a second case that uses twice the injection rate.
Install pyopmspe11, download the example configuration, and create the higher-rate configuration:
pip install git+https://github.com/OPM/pyopmspe11.git
curl -L -O https://raw.githubusercontent.com/OPM/pyopmspe11/main/examples/spe11b.toml
cp spe11b.toml spe11b_larger_inj.toml
sed -i.bak 's/0.035/0.07/g' spe11b_larger_inj.toml
rm -f spe11b_larger_inj.toml.bak
Run both simulations:
pyopmspe11 -i spe11b.toml -o spe11b -fz 0
pyopmspe11 -i spe11b_larger_inj.toml -o spe11b_larger_inj -fz 0
The first case uses the injection rate defined in spe11b.toml. The second
configuration replaces 0.035 kg/s with 0.07 kg/s.
Create a masked comparison#
Plot the liquid-phase CO2 mass fraction from both simulations and use
satnum as a static background mask:
plopm -v xco2l -sg 1,2 -i 'spe11b/SPE11B spe11b_larger_inj/SPE11B_LARGER_INJ' -fs 16,2.5 -mv satnum -r 0,1,2,3,4,5 -m gif -dpi 1000 -t 'spe11b spe11b larger injection' -fz 16 -gi 1000 -gl 1 -cbf .2f -cbp 0.30,0.01,0.4,0.02

Liquid-phase CO2 mass fraction for the base case and the case with the
larger injection rate. satnum provides the static background mask.#
The principal options are:
Animate gas saturation#
Create an unmasked gas-saturation animation, display the grid edges, and show the spatial coordinates in kilometres:
plopm -i spe11b/SPE11B -v sgas -tu y -c cet_cwr -ge 'black,5e-3' -fs 16,5 -m gif -dpi 1000 -fz 20 -gi 1000 -gl 1 -cbf .2f -asp 0 -xu km -yu km -xf .1f -yf .1f -cbn 5 -cbl 'Gas saturation [-]'
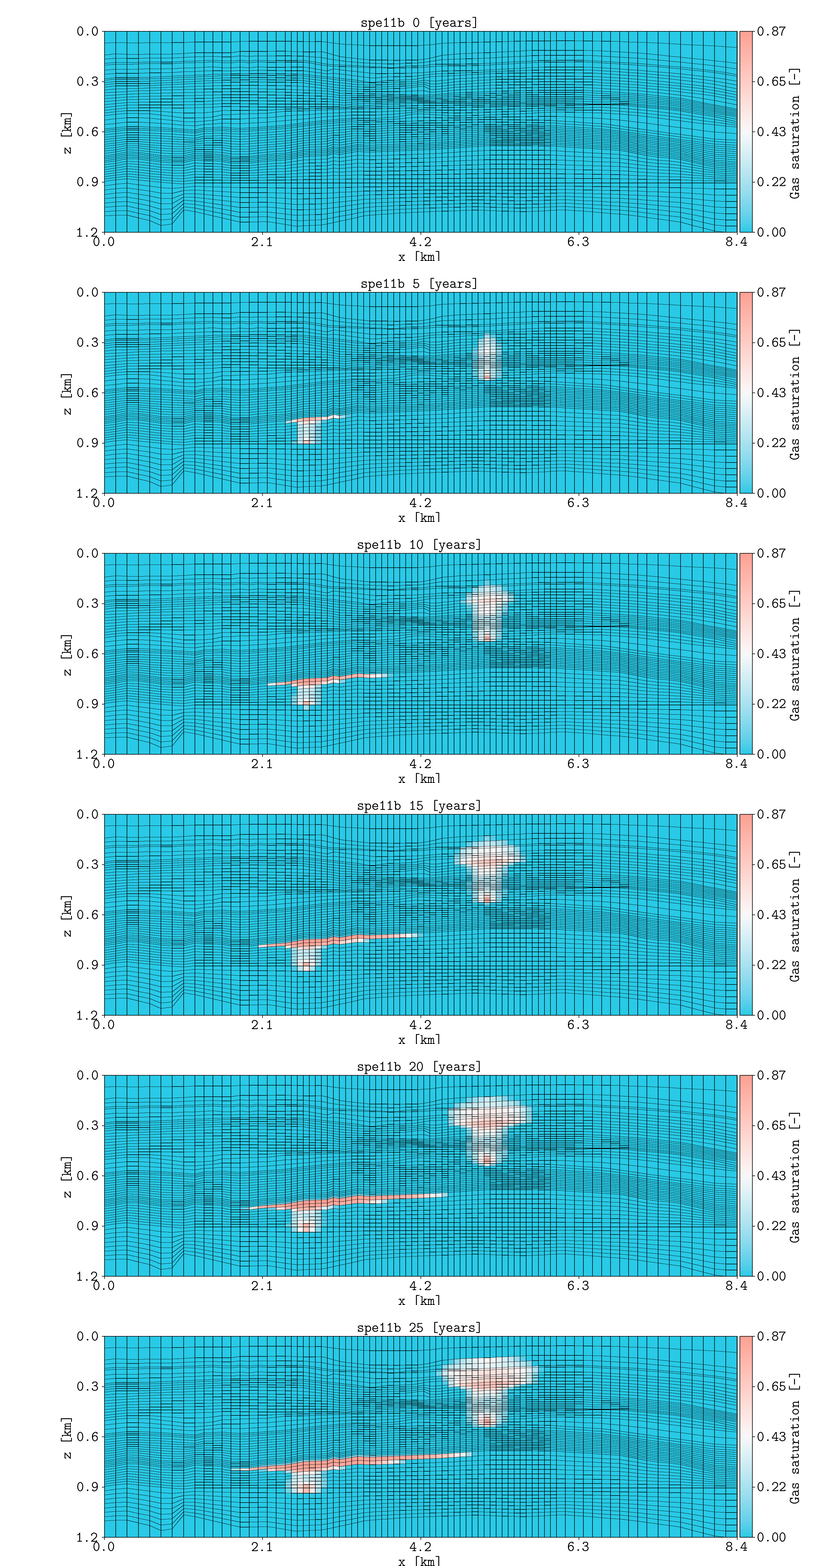
Gas saturation through time with visible grid edges and distances expressed in kilometres.#
Here, plopm -ge controls the grid-edge color and width,
plopm -asp disables equal axis scaling, and
plopm -tu displays time in years.
Tip
Use -tu empty to hide the time label from the animation.
Reproduce this example#
Run the complete workflow from the repository root:
. ./tests/scripts/docs_gif_mask.sh