
Relative permeability and capillary pressure#
Plot saturation functions stored in an OPM Flow deck, including hysteresis curves when they are available.
Variable syntax#
Use the saturation-function variable name by itself to read the first SATNUM
table. Append a table number to select another SATNUM region, or append h
to select hysteresis curves.
Examples include:
krgGas relative permeability from the first SATNUM table.
krg2Gas relative permeability from SATNUM table 2.
krghGas relative-permeability hysteresis curve.
krwhWater relative-permeability hysteresis curve.
pcwgGas-water capillary pressure from the first SATNUM table.
Plot hysteresis relative permeability#
Plot the hydrogen and brine hysteresis curves from the H2HYSTERESIS model:
plopm -i H2HYSTERESIS -v krgh,krwh -llb 'Hydrogen Brine' -c r,#0314fc -x '[0,1]' -lw 5 -fz 18 -fs 8,6 -yl 'Relative permeability, $k_r$ [-]' -xl 'Liquid saturation, $s_w$ [-]' -ls solid,solid -xnt 6 -ynt 6
The variables krgh and krwh select the gas and water hysteresis curves.
The legend labels are separated by two spaces and correspond to the variables
in the order supplied through plopm -v.
Plot capillary pressure#
Plot the gas-water capillary-pressure curve on a logarithmic y-axis:
plopm -i H2HYSTERESIS -v pcwg -c k -x '[0,1]' -lw 5 -ll empty -fz 18 -fs 8,6 -yl 'Capillary pressure, $p_c$ [bar]' -xl 'Liquid saturation, $s_w$ [-]' -xnt 6 -ylog 1
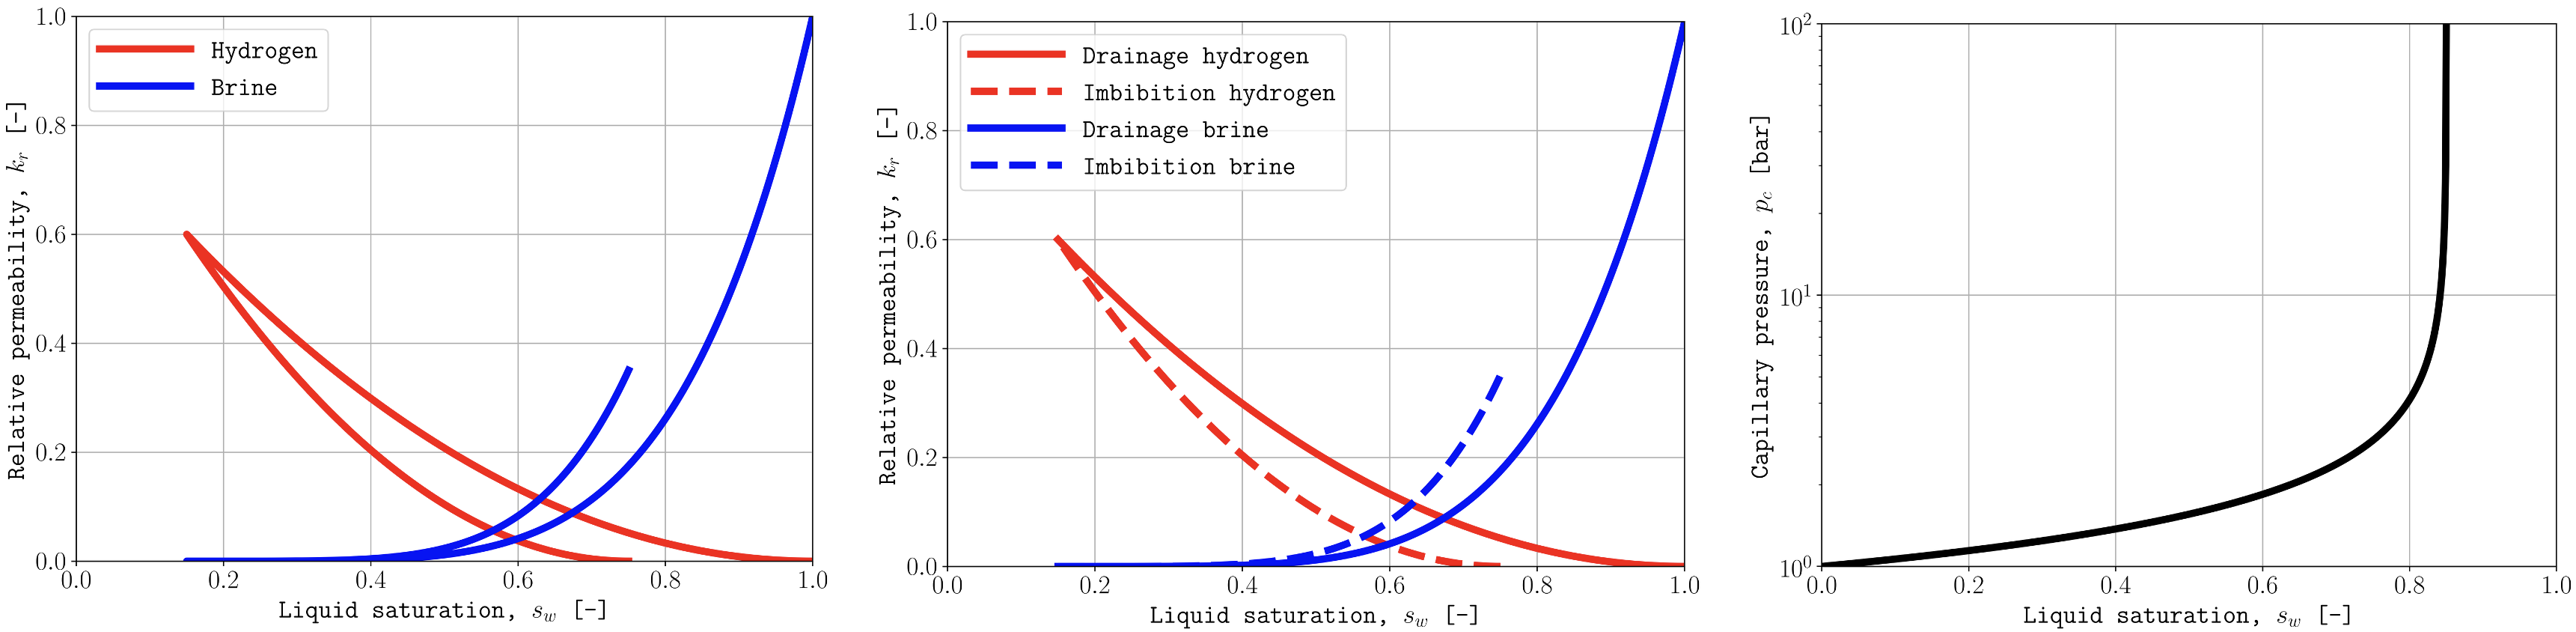
Relative-permeability hysteresis curves for hydrogen and brine, together with gas-water capillary pressure.#
Format the curves#
The plotting options control both saturation-function figures:
plopm -xlimits liquid saturation to the interval from 0 to 1.plopm -lwsets the line width.plopm -fssets the figure size.plopm -xntandplopm -yntset the axis tick counts.plopm -llremoves the capillary-pressure legend.plopm -ylogenables logarithmic scaling for capillary pressure.
Note
The requested SATNUM table or hysteresis data must be present in the OPM input deck. If no suffix is supplied, plopm reads the first available saturation-function table.
Reproduce this example#
Run the complete workflow from the repository root:
. ./tests/scripts/docs_rel_perms_and_capillary_pressure.sh