
Colormaps and subfigures#
Use named colormaps, RGB values, or hexadecimal colors to customize discrete and continuous variables. Combine several plots in one figure with either individual or shared colorbars.
Select colors#
Use plopm -c with:
A Matplotlib colormap name, such as
viridisorSpectral.A Colorcet colormap name, such as
cet_glasbey_bw.RGB colors written as
red;green;bluevalues.Hexadecimal colors written as
#RRGGBB.
Separate colors belonging to one discrete palette with spaces. Separate the color specifications for different plots with commas.
Compare three color specifications#
Plot satnum, fipnum, and disperc with a custom RGB palette, a
Colorcet colormap, and two hexadecimal colors:
plopm -i SPE11B -v satnum,fipnum,disperc -c '193;147;56 127;148;191 193;127;97 181;73;57 81;124;66 101;64;147 134;133;130',cet_glasbey_bw,'#b6c406 #fffa86' -sg 3,1 -rdl 1 -cbn 3,6,2 -cbf .0f,.0f,.1f -fs 7,4
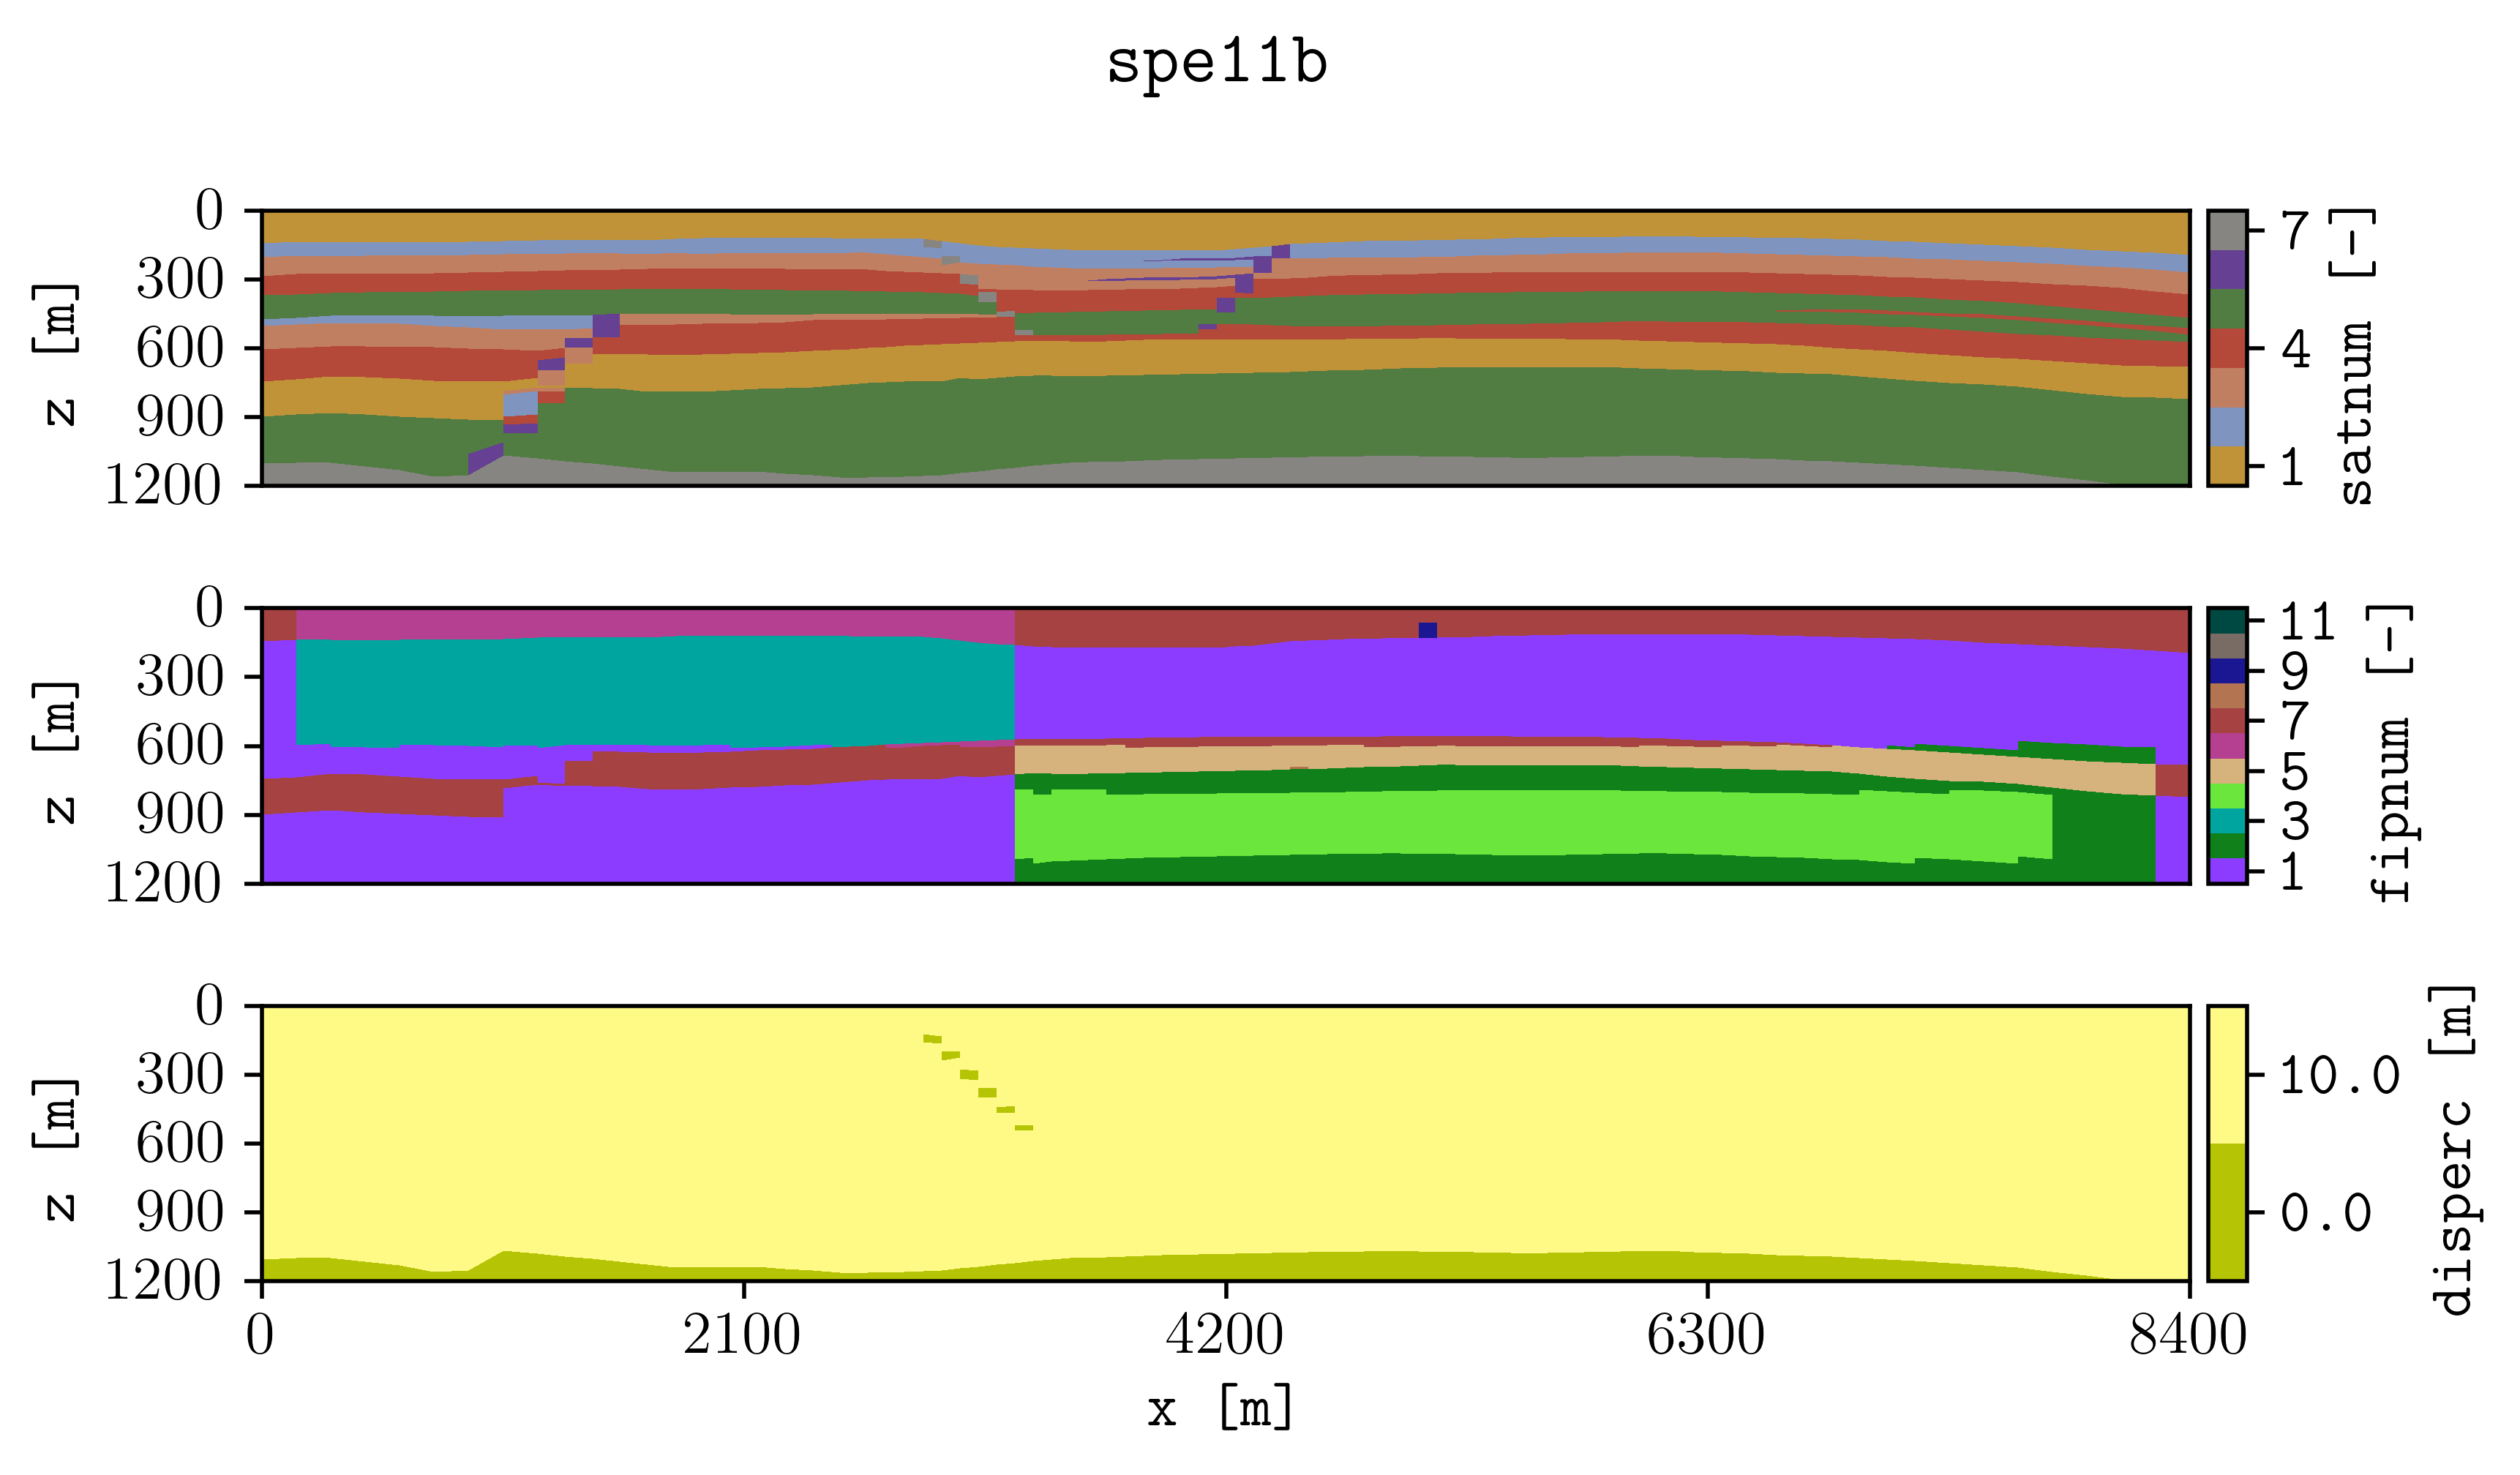
satnum uses a custom RGB palette, fipnum uses
cet_glasbey_bw, and disperc uses two hexadecimal colors.#
The custom RGB palette contains seven colors, one for each SPE11 facies:
193;147;56
127;148;191
193;127;97
181;73;57
81;124;66
101;64;147
134;133;130
The remaining options control the combined figure:
plopm -sgarranges the three plots in three rows and one column.plopm -rdlremoves repeated axis labels.plopm -cbnsets 3, 6, and 2 colorbar ticks for the three plots.plopm -cbfsets the corresponding colorbar number formats.plopm -fssets the figure size.
Note
Quote color specifications containing spaces, semicolons, or hexadecimal values so the shell passes them to plopm as one argument.
Subfigures with individual colorbars#
Combine static and dynamic quantities in one figure. When the plotted quantities use different value ranges or colormaps, each subplot has its own colorbar:
plopm -i SPE11B -v poro,sgas,sgas -sg 1,3 -r 0,1,5 -st 0 -fs 25,2 -c terrain,jet,jet -cbn 5 -cbf .1f -fn poro_sgas

Porosity and gas saturation at two restart steps, displayed with individual colorbars.#
The command applies the values in each comma-separated list in subplot order:
porois plotted at restart step 0 with theterraincolormap.The first
sgasplot uses restart step 1 and thejetcolormap.The second
sgasplot uses restart step 5 and thejetcolormap.plopm -sgarranges the three plots in one row.plopm -stremoves the common figure title.plopm -fnsets the output filename toporo_sgas.
Subfigures with a shared colorbar#
When subfigures show the same quantity from different inputs or restart steps,
use one shared colorbar. Position and size the shared colorbar with
plopm -cbp:
plopm -i 'SPE11B SPE11C SPE11B SPE11C' -sg 2,2 -v temp -s ',1, ,14, ,1, ,14,' -r 0,0,5,2 -st 0 -fs 10,10 -asp 0 -rdl 1 -c cet_diverging_rainbow_bgymr_45_85_c67_r -cbn 5 -cbp 0.15,0.92,0.7,0.02 -cbl 'Temperature [$^o$C]' -t 'SPE11B (initial temperature) SPE11C (initial temperature) SPE11B (end of simulation, 25 y) SPE11C (end of simulation, 25 y)' -fz 15
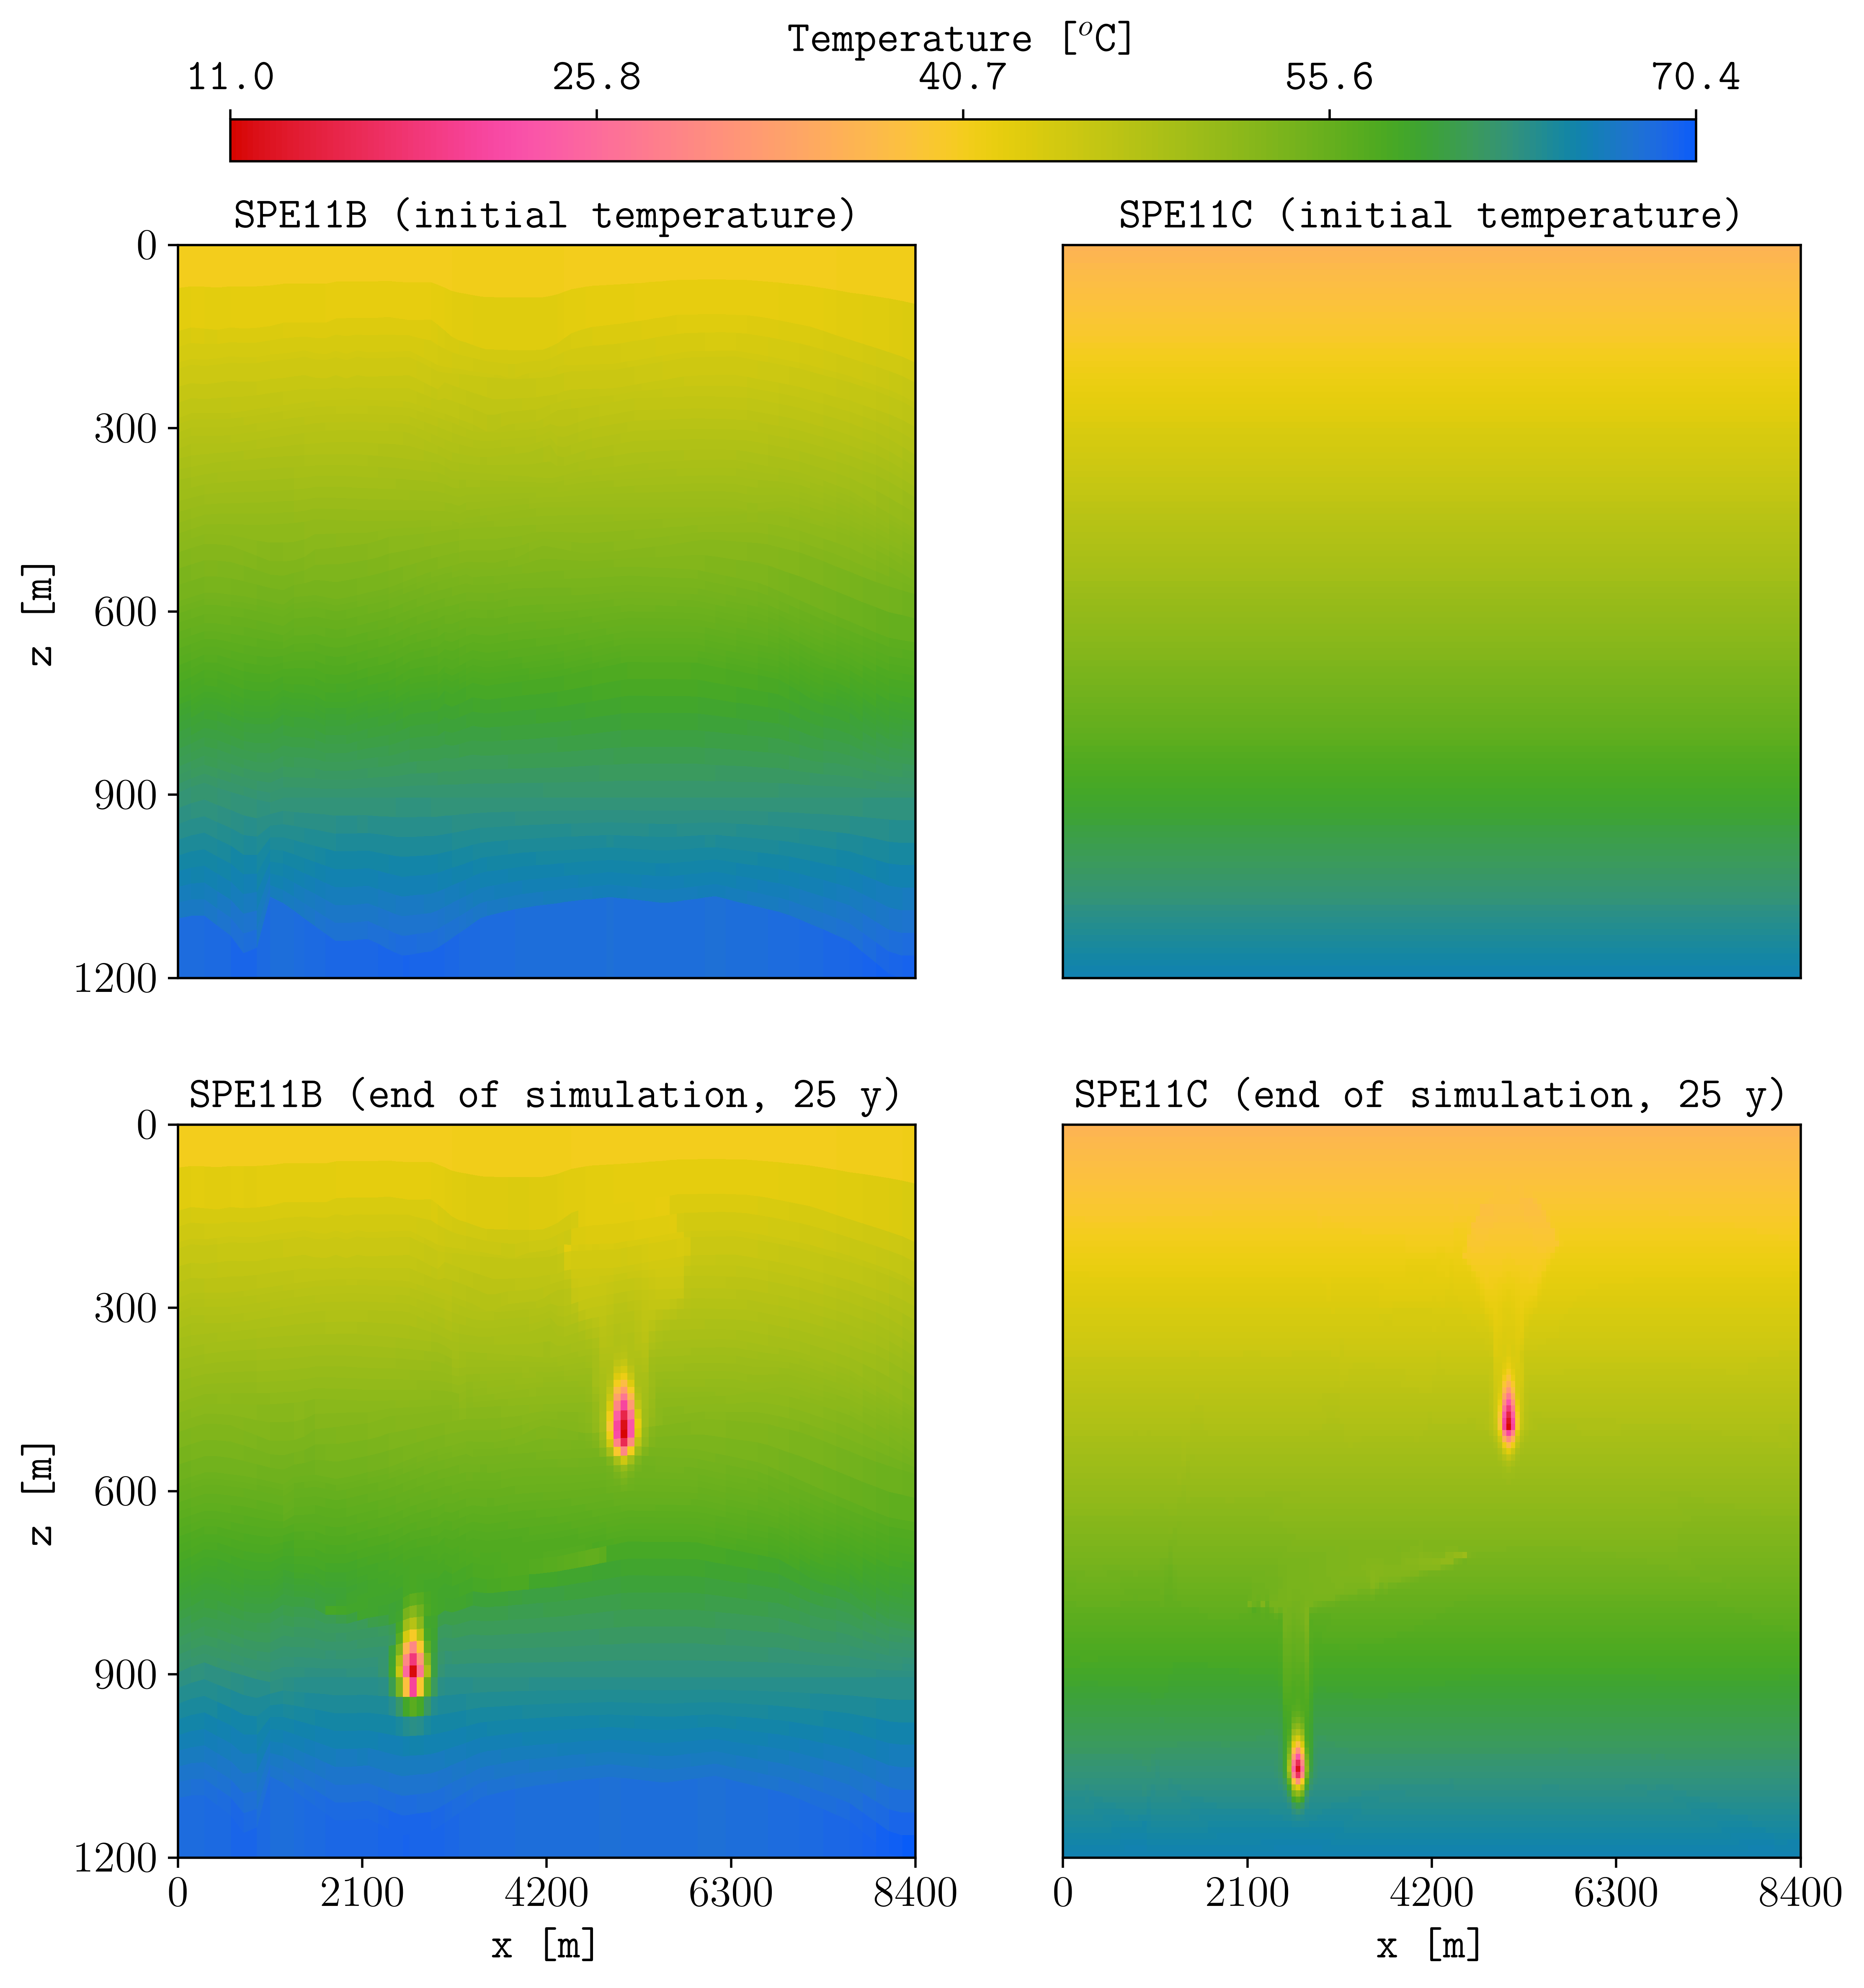
Initial and final temperatures for SPE11B and SPE11C, displayed with one shared colorbar.#
The four inputs, slices, restart steps, and titles correspond by position:
SPE11B -> slice ,1,  -> restart 0 -> initial SPE11B temperature
SPE11C -> slice ,14, -> restart 0 -> initial SPE11C temperature
SPE11B -> slice ,1,  -> restart 5 -> SPE11B after 25 years
SPE11C -> slice ,14, -> restart 2 -> SPE11C after 25 years
The shared-colorbar options are:
plopm -cbpsetsleft,bottom,width,heightin figure coordinates.plopm -cbnsets the number of colorbar ticks.plopm -cblsets the shared colorbar label.plopm -capplies one common colormap to all four temperature maps.
plopm -asp disables equal axis scaling, while
plopm -rdl removes repeated subplot labels. Two spaces separate the
four titles supplied through plopm -t.
Reproduce this example#
Run the complete workflow from the repository root:
. ./tests/scripts/docs_colormaps-subfigures.sh