
Histograms#
Plot distributions of static reservoir properties and optionally fit probability distributions to the data.
Plot porosity and permeability distributions#
Plot porosity and x-direction permeability from the Norne model. Use 20 bins for each histogram, fit a normal distribution to porosity, and fit a lognormal distribution to permeability:
plopm -i NORNE_ATW2013 -v poro,permx -hist '20,norm 20,lognorm' -ag 0 -sg 1,2 -fs 15,5 -ll 'upper center' -y '[0,10000] [0,23000]' -c '#7274b3,#cddb6e'
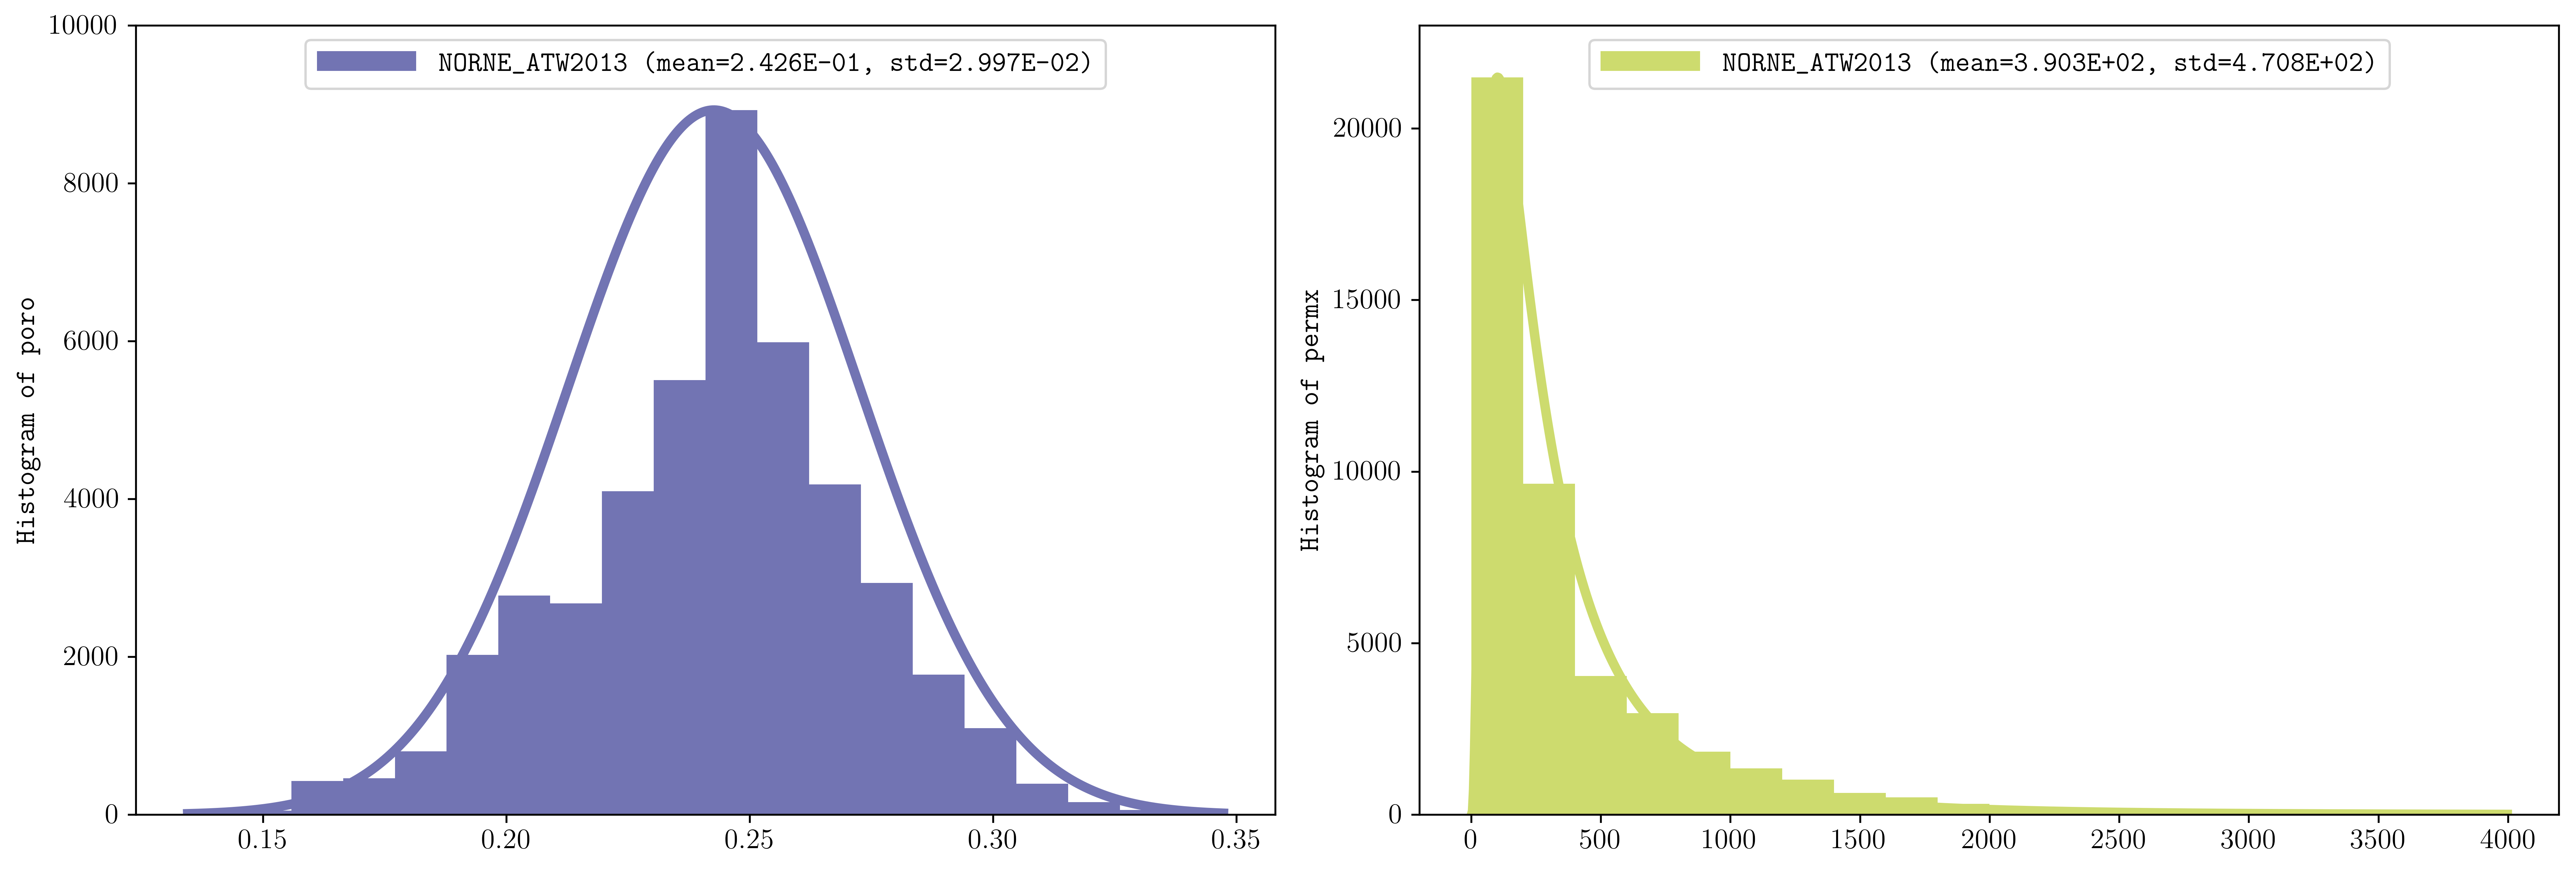
Porosity with a fitted normal distribution and x-direction permeability with a fitted lognormal distribution.#
Histogram syntax#
Use plopm -hist to set the number of bins and an optional fitted
distribution:
20Creates a histogram with 20 bins and no fitted distribution.
20,normCreates a histogram with 20 bins and fits a normal distribution.
20,lognormCreates a histogram with 20 bins and fits a lognormal distribution.
Separate specifications for multiple plots with spaces. In this example,
20,norm 20,lognorm applies the normal fit to poro and the lognormal fit
to permx.
Format the figure#
The remaining options control the subplot layout and appearance:
plopm -agdisables the axis grid.plopm -sgplaces both histograms in one row with two columns.plopm -fssets the complete figure size to 15 by 5 inches.plopm -llplaces each legend at the upper center.plopm -yapplies separate y-axis limits to the two plots.plopm -cassigns a different color to each histogram.
The two y-axis limits are separated by a space and correspond to the variables
in the order supplied through plopm -v.
Note
Lognormal fitting is appropriate only for positive values. Review the data and selected property before choosing a fitted distribution.
Reproduce this example#
Run the complete workflow from the repository root:
. ./tests/scripts/docs_histograms.sh