
Generic deck#
Use plopm with a generic OPM Flow model. This example uses SPE10 MODEL 2 to plot a reservoir property, inspect the grid, and display the wells.
Plot vertical permeability#
Plot vertical permeability on the fourth slice in the xz plane:
plopm -i SPE10_MODEL2 -v permz -s ,4, -clog 1 -xu km -yu km -xnt 6 -yf .2f -t 'K$_z$ at the fourth slice in the xz plane' -cl '[1e-7,1e3]'
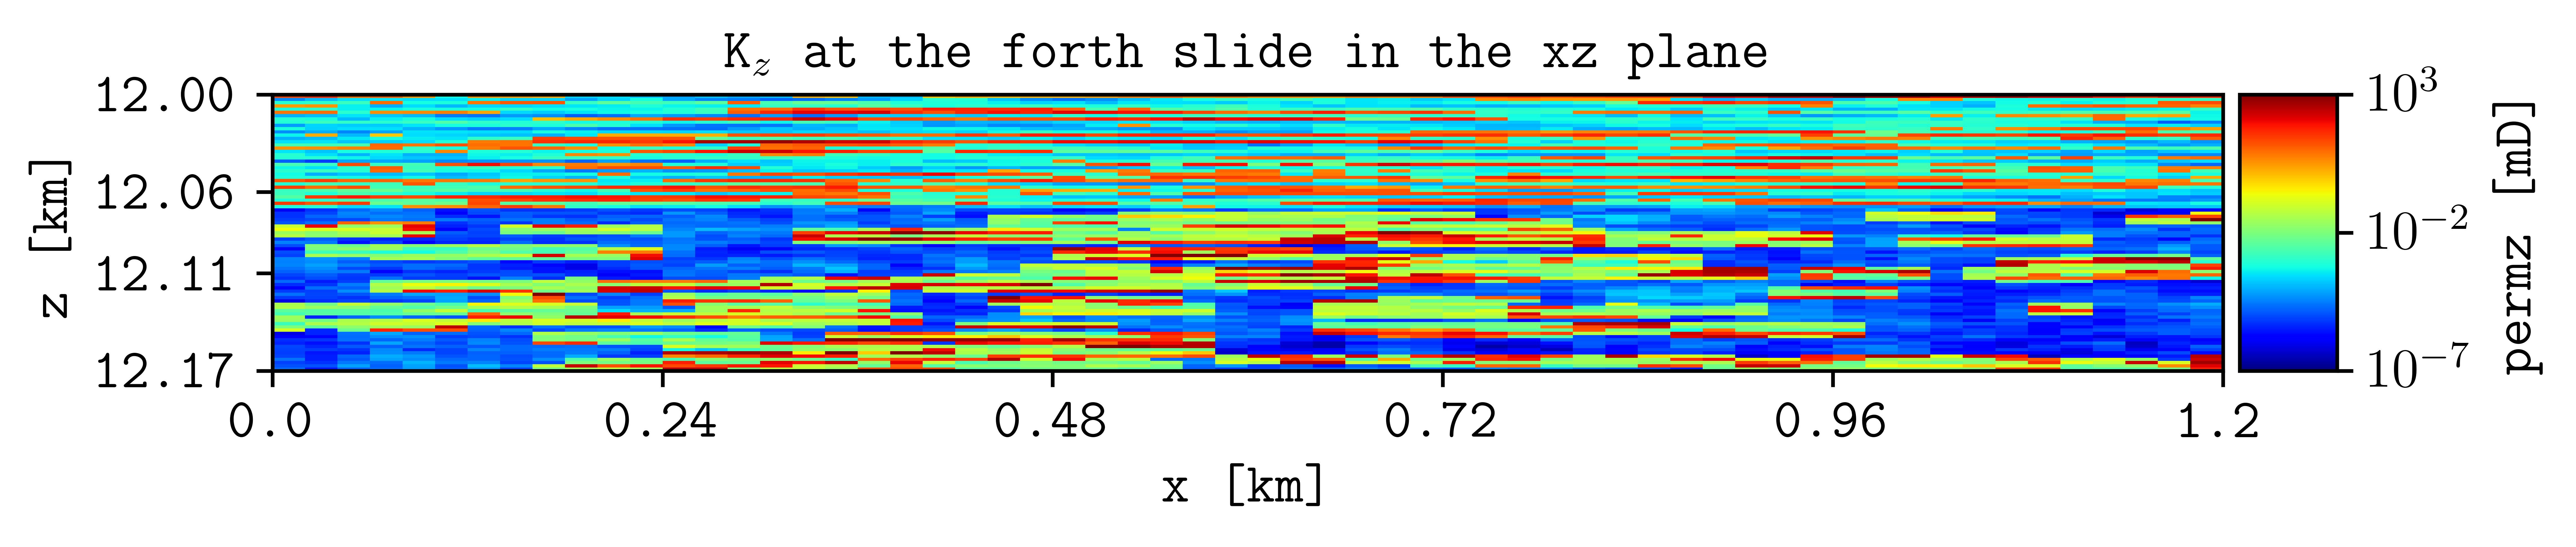
Vertical permeability on the fourth xz slice, displayed with a logarithmic
color scale between 1e-7 and 1e3 mD.#
The main options are:
plopm -vselects vertical permeability,permz.plopm -sselects the fourth cell in the y direction and leaves the x and z entries empty, producing an xz slice.plopm -clogenables logarithmic color scaling.plopm -clsets fixed color-scale limits.plopm -xuandplopm -yudisplay spatial coordinates in kilometres.plopm -xntsets the number of x-axis ticks.plopm -yfformats the y-axis tick labels with two decimal places.
Plot the grid from above#
Select the first layer and use the special variable grid to inspect the
model geometry from above:
plopm -i SPE10_MODEL2 -s ,,1 -fs 3,4 -fz 8 -v grid -hide 0,0,1,0
The four values supplied to plopm -hide control the left axis,
bottom axis, colorbar, and title, in that order. Here, the colorbar is hidden
while the axes and title remain visible.
Plot the wells from above#
Use the same layer selection with the special variable wells:
plopm -i SPE10_MODEL2 -s ,,1 -fs 3,4 -fz 8 -v wells -hide 0,0,0,1
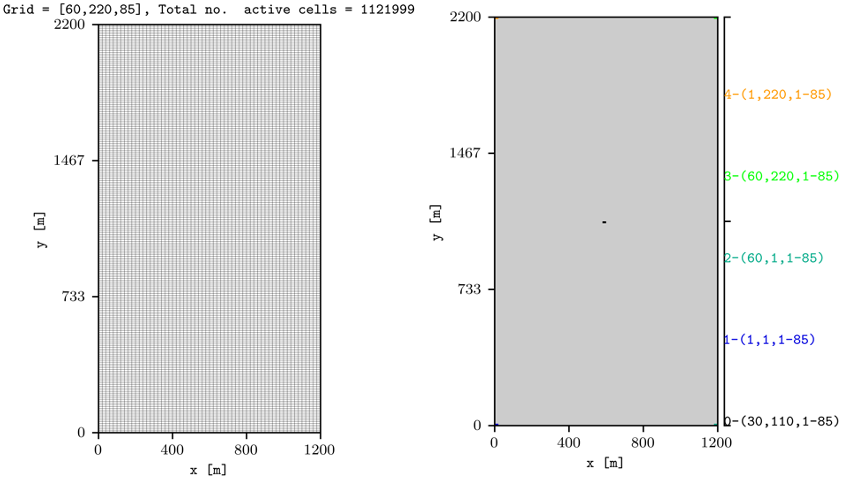
Top views of the SPE10 MODEL 2 grid and declared wells.#
For the wells plot, the final value in plopm -hide removes the title.
The well locations must be available in the OPM input deck.
Reproduce this example#
Run the complete workflow from the repository root:
. ./tests/scripts/docs_generic_deck.sh