
Hello world#
Create spatial maps, summary plots, and cell time series from an SPE11B model.
Run the default command#
Run the following command from the examples directory:
plopm -i SPE11B
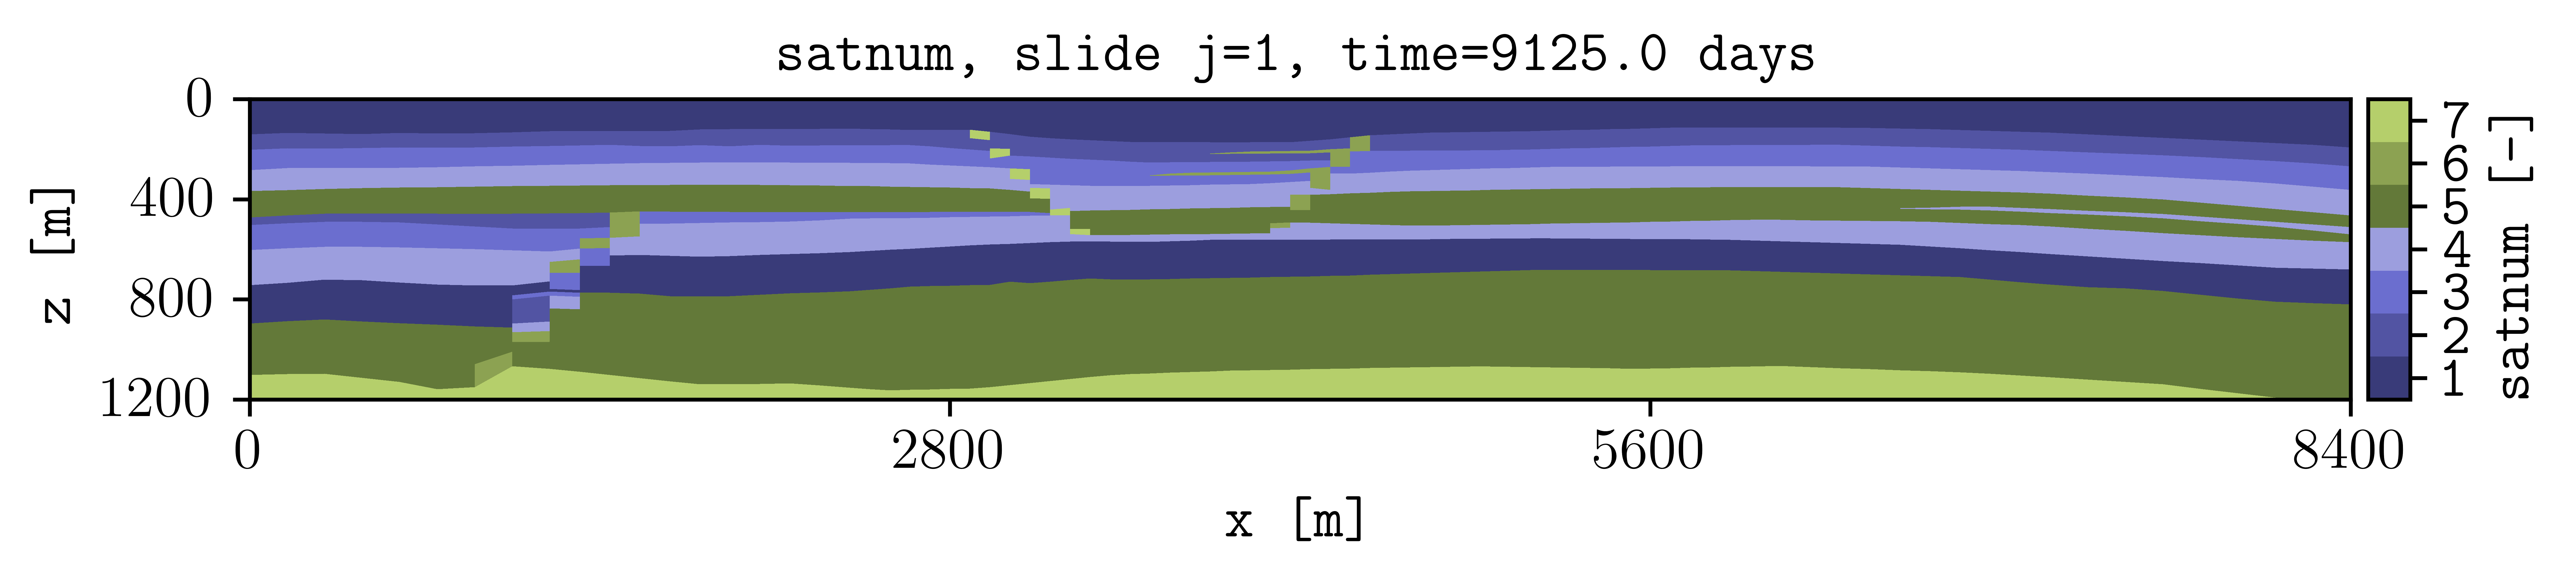
The default command plots the standard static variables. This figure shows
satnum on the default ,1, slice at the final restart step.#
When plopm -v is omitted, plopm plots its default variable set.
The default spatial selection is ,1,, which displays the first xz slice.
Plot gas saturation#
Select gas saturation at restart step 4 and customize the colorbar:
plopm -i SPE11B -v sgas -r 4 -cbn 3 -c cubehelix -cbt '[0, middle, 0.9]'
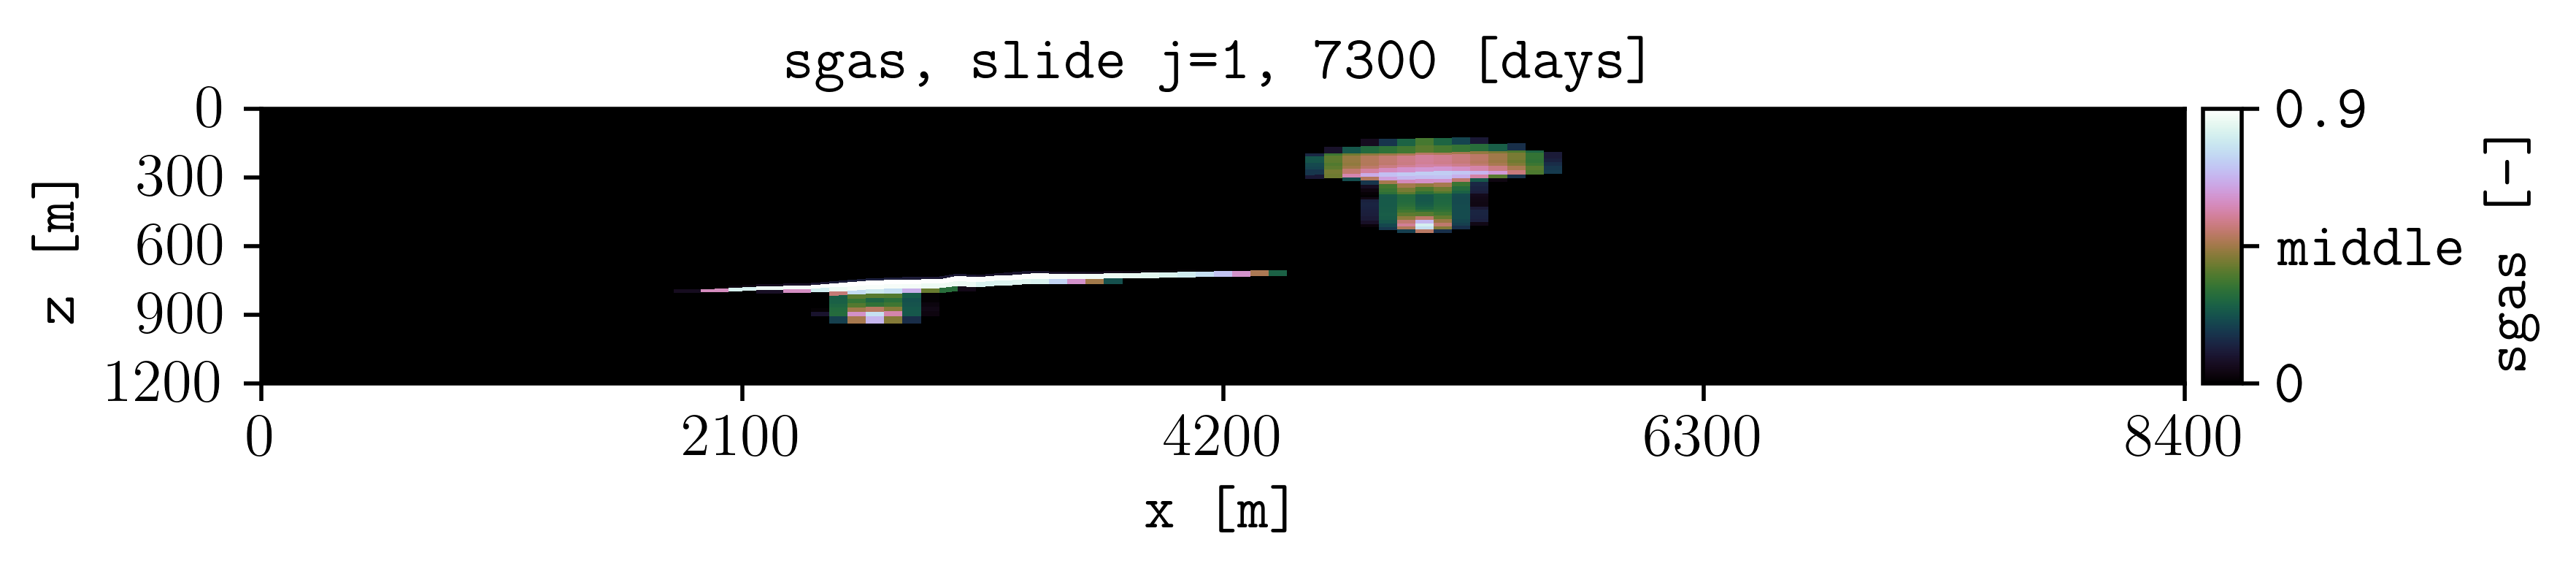
Gas saturation on the default xz slice at restart step 4.#
The command uses:
plopm -vto selectsgas.plopm -rto select restart step 4.plopm -cto select thecubehelixcolormap.plopm -cbnto use three colorbar ticks.plopm -cbtto replace the numeric tick labels with custom text.
Plot field gas in place#
Summary quantities are plotted over time rather than on a spatial slice. Plot field gas in place with dates on the x-axis:
plopm -i SPE11B -v fgip -c b -ls dotted -fz 12 -fs 5,5 -lw 4 -tu dates
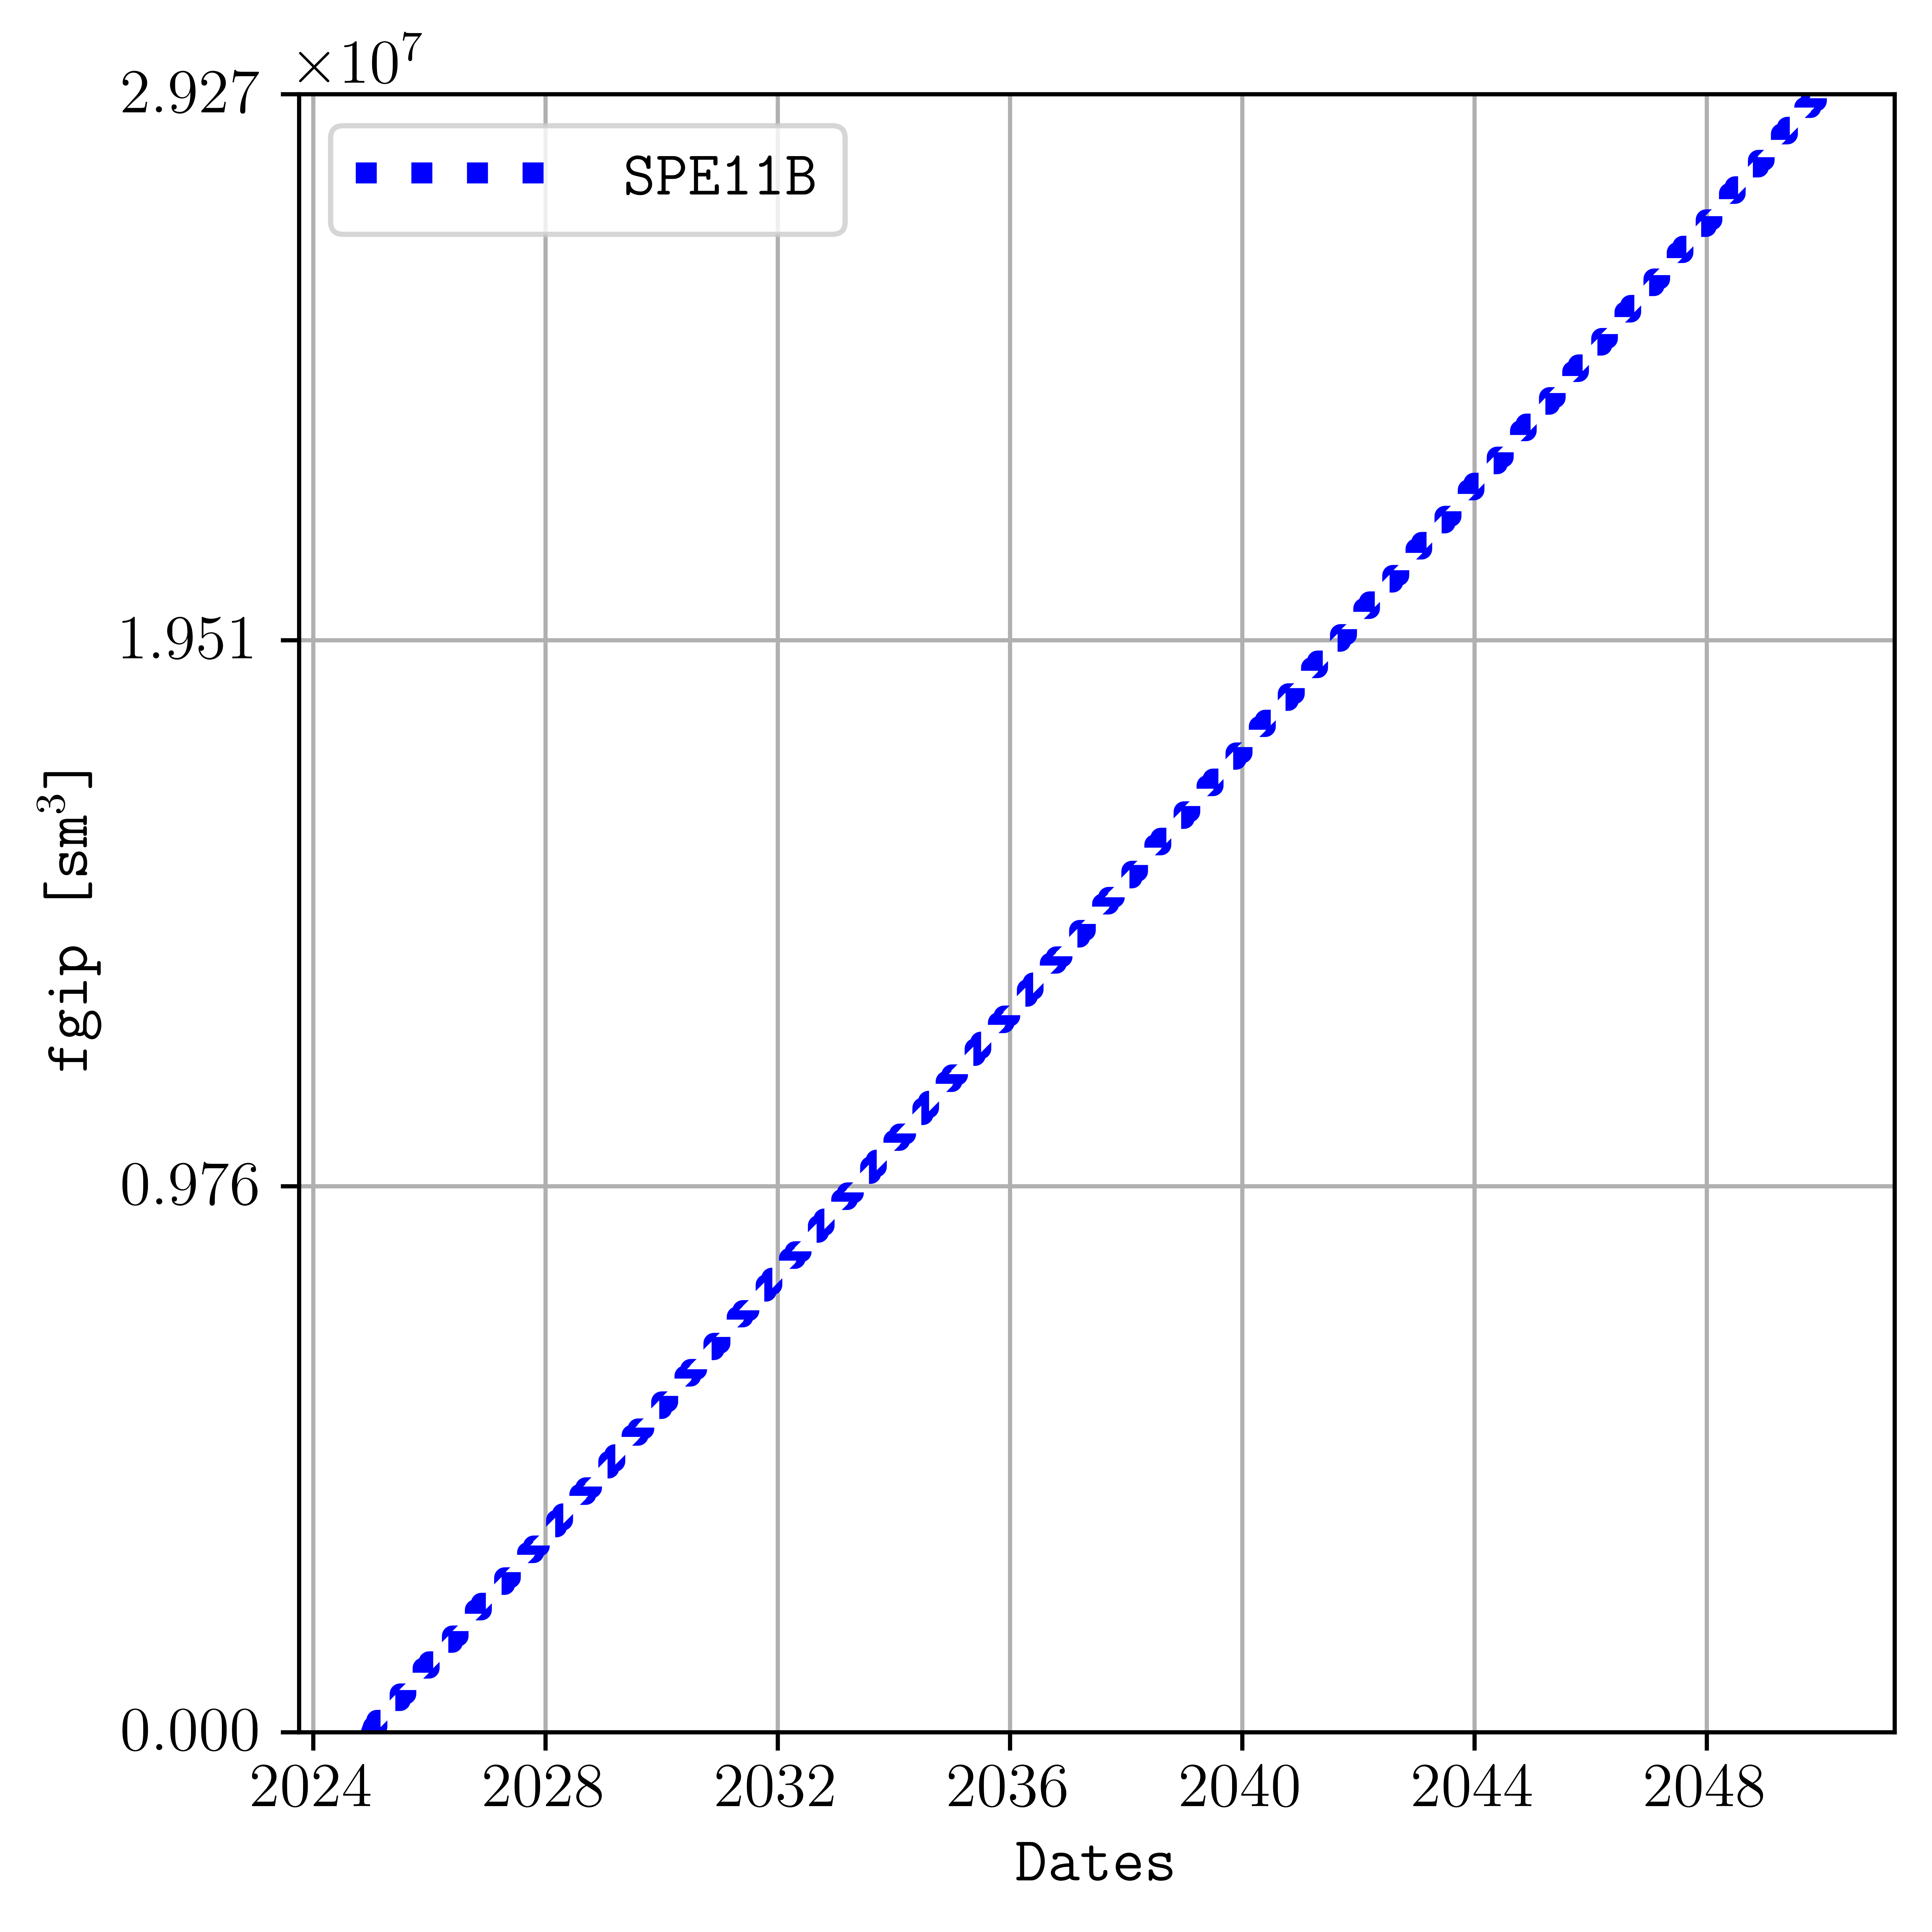
Field gas in place plotted against simulation dates.#
Here, plopm -tu selects dates, while plopm -c,
plopm -ls, and plopm -lw control the line appearance.
Plot cell values over time#
Select three cells and plot pressure increase relative to the initial pressure:
plopm -i 'SPE11B SPE11B SPE11B' -v 'pressure - 0pressure' -s '1,1,1 41,1,29 83,1,58' -llb 'Top left corner Middle Right lower corner' -yl 'Pressure increase at the sensor locations [bar]' -yf .0f -xnt 11 -tu dates
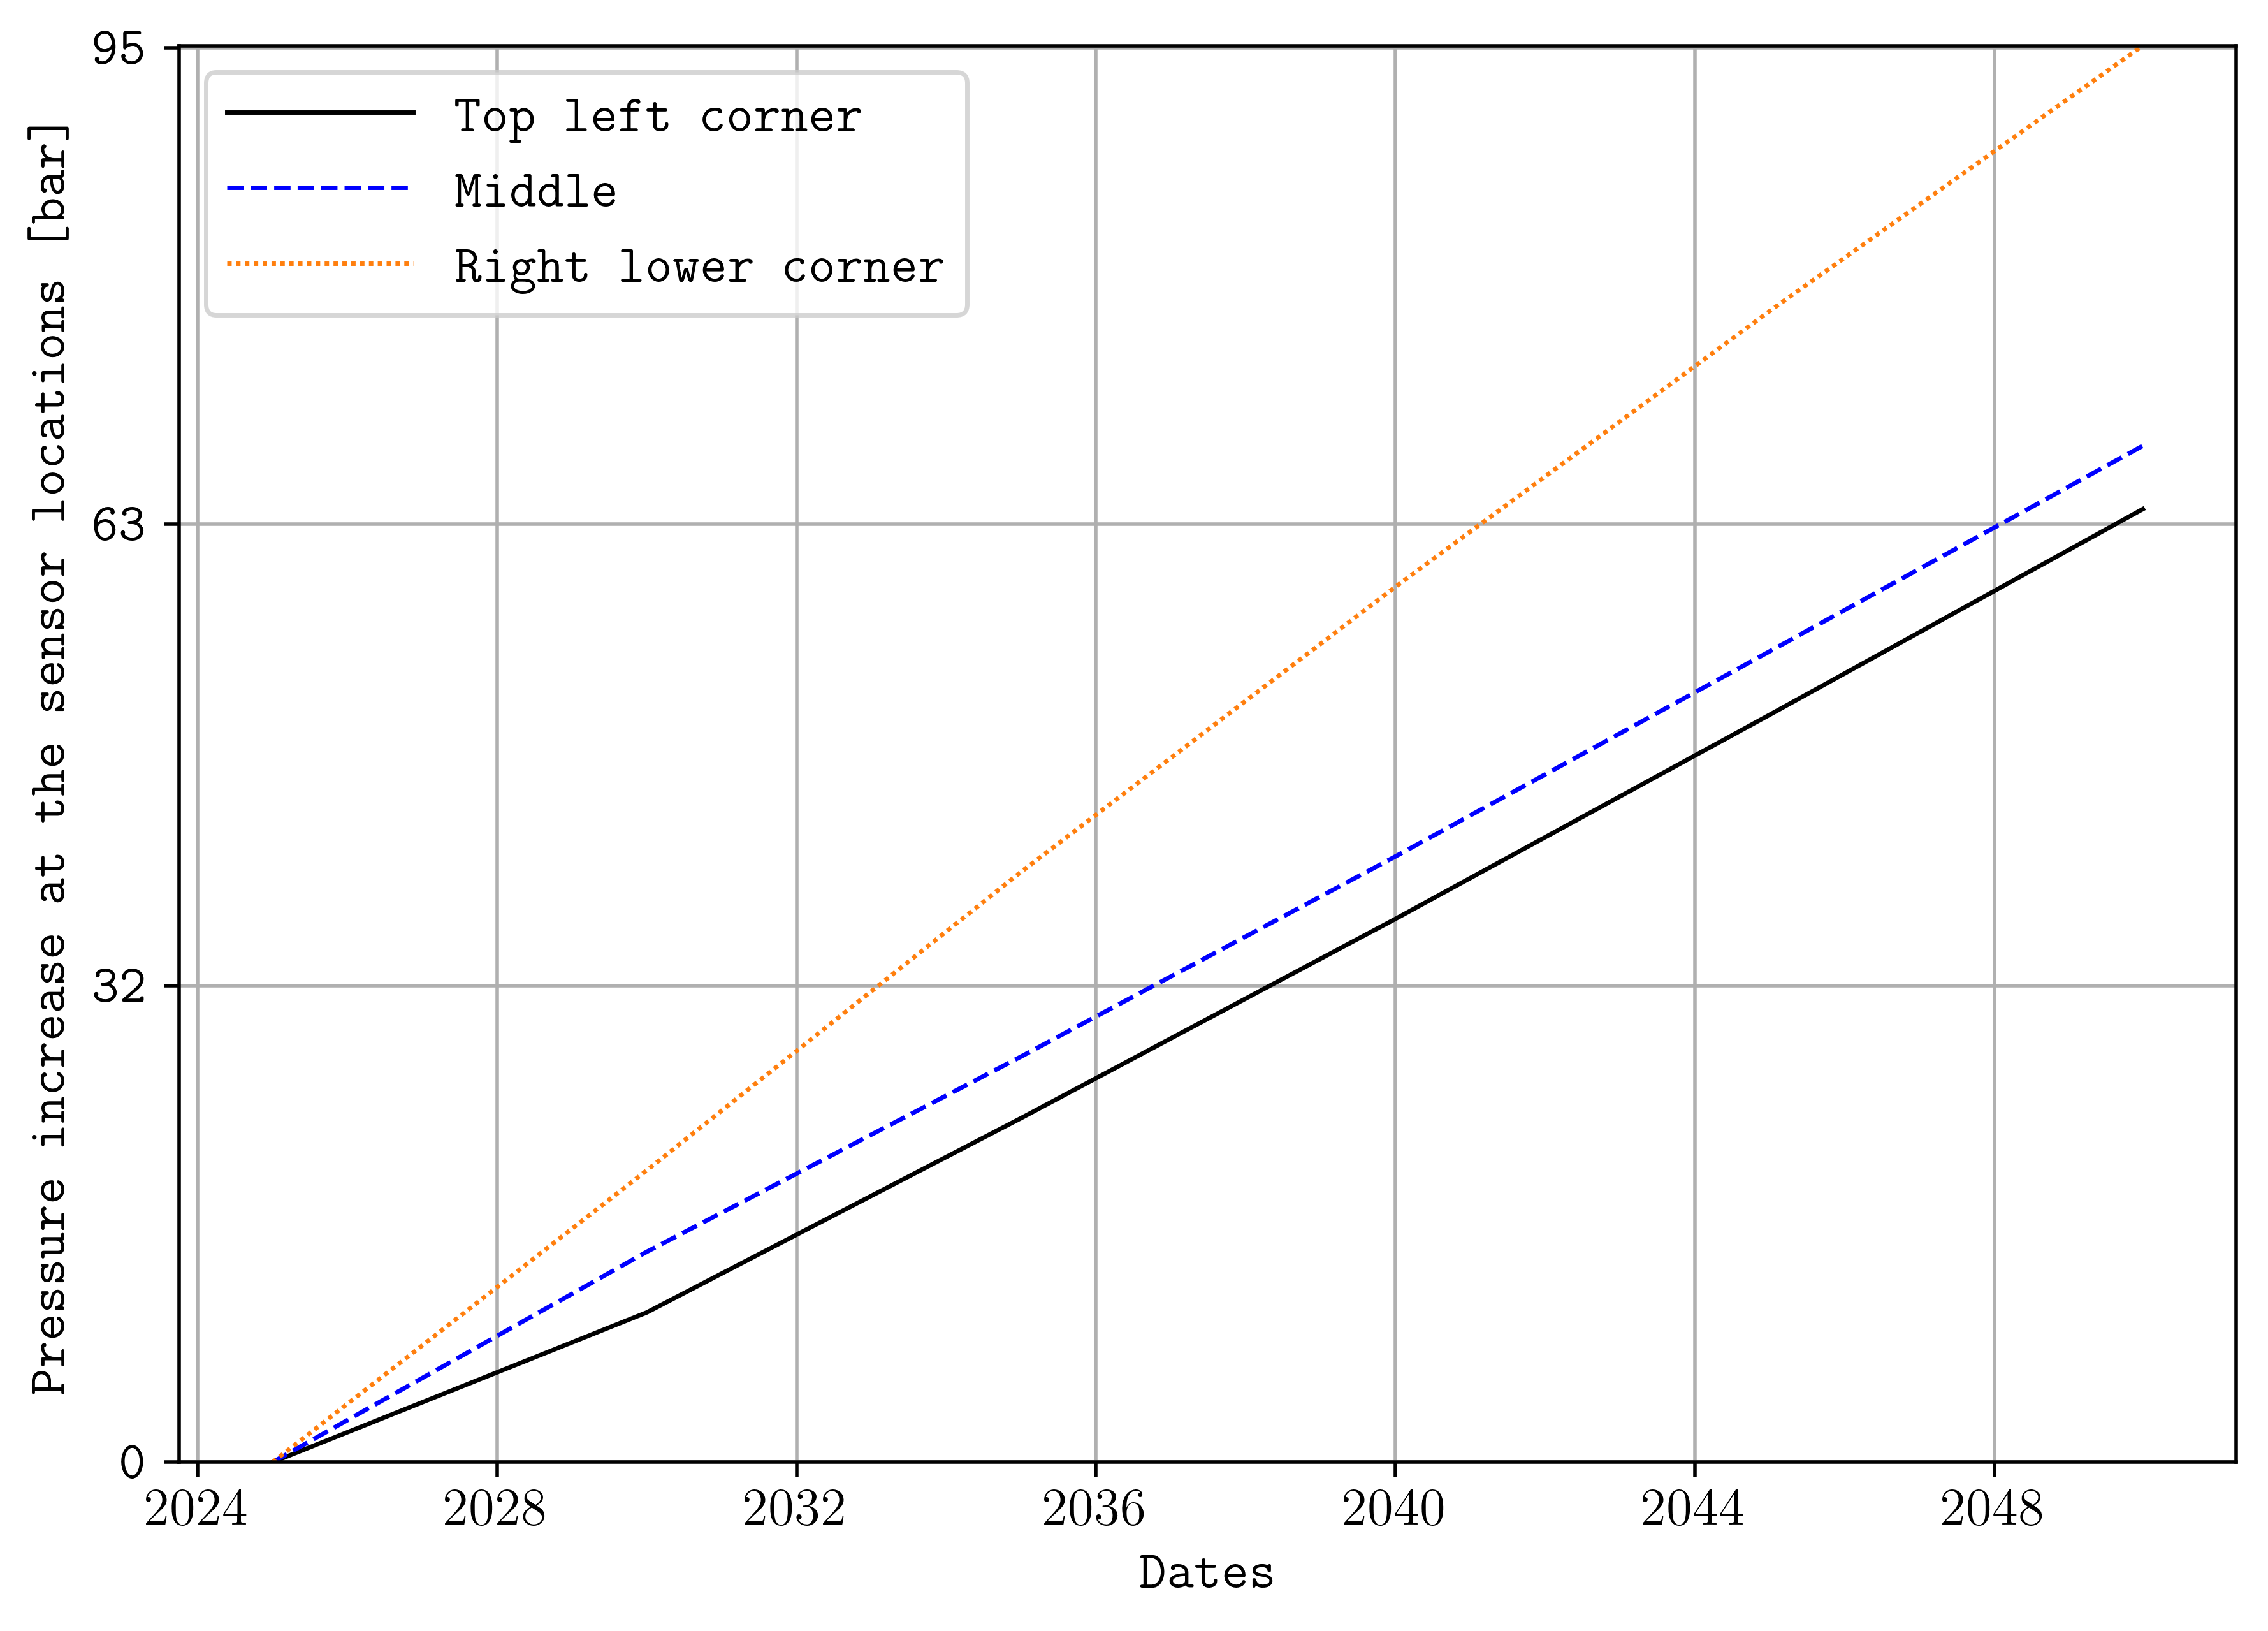
Pressure increase at cells near the top-left corner, middle, and lower-right corner of the model.#
Three indices in plopm -s select one cell over time. The three input
entries correspond to the three cell selections. The expression
pressure - 0pressure subtracts the initial pressure from each time step.
The legend labels are separated by two spaces. plopm -yf displays
pressure values without decimal places, and plopm -xnt sets eleven
x-axis ticks.
Reproduce this example#
Run the complete workflow from the repository root:
. ./tests/scripts/docs_hello_world.sh