
Graphical abstract#
Reproduce the main elements of the plopm graphical abstract. The workflow combines three different uses of plopm:
A summary comparison between two SPE11B simulations.
A transformed top view of the Norne model.
VTK output from a three-dimensional SPE11C model for visualization in ParaView.
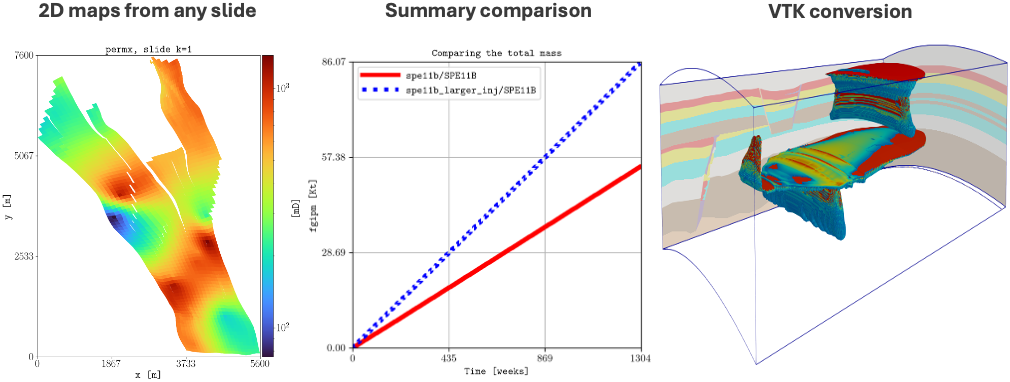
The plopm graphical abstract combines summary plotting, spatial-map generation, and VTK export.#
Compare two SPE11B simulations#
Generate a base SPE11B case and a second case with a higher injection rate. The maintained script downloads the pyopmspe11 configuration, modifies the injection rate, and runs both simulations before creating the comparison.
Plot field gas mass in place for both cases and convert the values from kilograms to kilotonnes directly in the variable expression:
plopm -i 'spe11b/SPE11B spe11b_higher_rate/SPE11B_HIGHER_RATE' -v 'fgmip * 1e-6' -c 'r,b' -tu y -xf .0f -lw 2 -llb 'Base case Higher injection rate' -xnt 6 -yl 'Total CO$_2$ mass [Kt]' -fz 18 -t 'Comparing two runs of the SPE11B model'
The command demonstrates:
Generate the Norne map#
Clone the OPM example-data repository and use an OPM Flow dry run to generate the files required by plopm:
git clone https://github.com/OPM/opm-data.git
flow opm-data/norne/NORNE_ATW2013.DATA --enable-dry-run=1
Plot horizontal permeability on the top layer, then rotate, translate, and crop the grid:
plopm -i opm-data/norne/NORNE_ATW2013 -v permx -clog 1 -rot 65 -s ,,1 -tr '[6456335.5,-3476500]' -x '[0,5600]' -y '[0,7600]' -t 'Top view of NORNE' -xu km -yu km -fz 16 -ge 'black,1e-2' -xf .1f -yf .1f -fs 8,8
This part of the graphical abstract demonstrates logarithmic color scaling, coordinate transformations, spatial cropping, grid edges, and unit conversion.
Generate SPE11C VTK files#
Install pyopmspe11, download its SPE11C example configuration, and run the case without output subfolders:
pip install git+https://github.com/OPM/pyopmspe11.git
curl -L -O https://raw.githubusercontent.com/OPM/pyopmspe11/refs/heads/main/examples/spe11c.toml
pyopmspe11 -i spe11c.toml -o spe11c -f 0
Export facies and liquid-phase CO2 mass fraction at the initial and final selected restart steps:
plopm -i spe11c/SPE11C -v satnum,xco2l -vf UInt16,Float16 -r 0,5 -m vtk
Here, plopm -vf assigns an unsigned 16-bit integer type to satnum
and a 16-bit floating-point type to xco2l. The generated VTK files can be
opened in ParaView for three-dimensional inspection.
Note
OPM Flow is required to run the SPE11 simulations and to prepare the Norne model. ParaView is required only to inspect the generated VTK files.
Reproduce this example#
Run the complete workflow from the repository root:
. ./tests/scripts/docs_graphical_abstract.sh